Langfuse is an open-source LLM engineering platform for tracing, debugging, and evaluating AI applications.
It addresses the operational overhead of managing non-deterministic outputs once a system grows beyond a simple prompt-response loop. Built on a ClickHouse-native architecture, it provides the telemetry infrastructure to monitor model performance, quality, and cost without slowing your critical path.
Langfuse gives you visibility into the internal states that traditional monitoring tools overlook. It records the exact prompts sent, the model's completions, token usage, and latency across complex agentic workflows — enough to move past anecdotal testing and into data-driven workflows where AI features are reliable and auditable.
The platform is framework-agnostic and OpenTelemetry-friendly, with integrations spanning the OpenAI SDK, LangChain, and LiteLLM.
Langfuse SDKs send tracing data asynchronously in the background through local queuing and batching, so the observability layer never touches your application's response time.
What is Langfuse?
Langfuse focuses on the engineering lifecycle of AI application development. Originally a YC W23 startup, it was acquired by ClickHouse in January 2026. That move settled its architecture around a high-performance analytical core built for the high-volume writes and complex queries that enterprise-grade LLM observability demands.
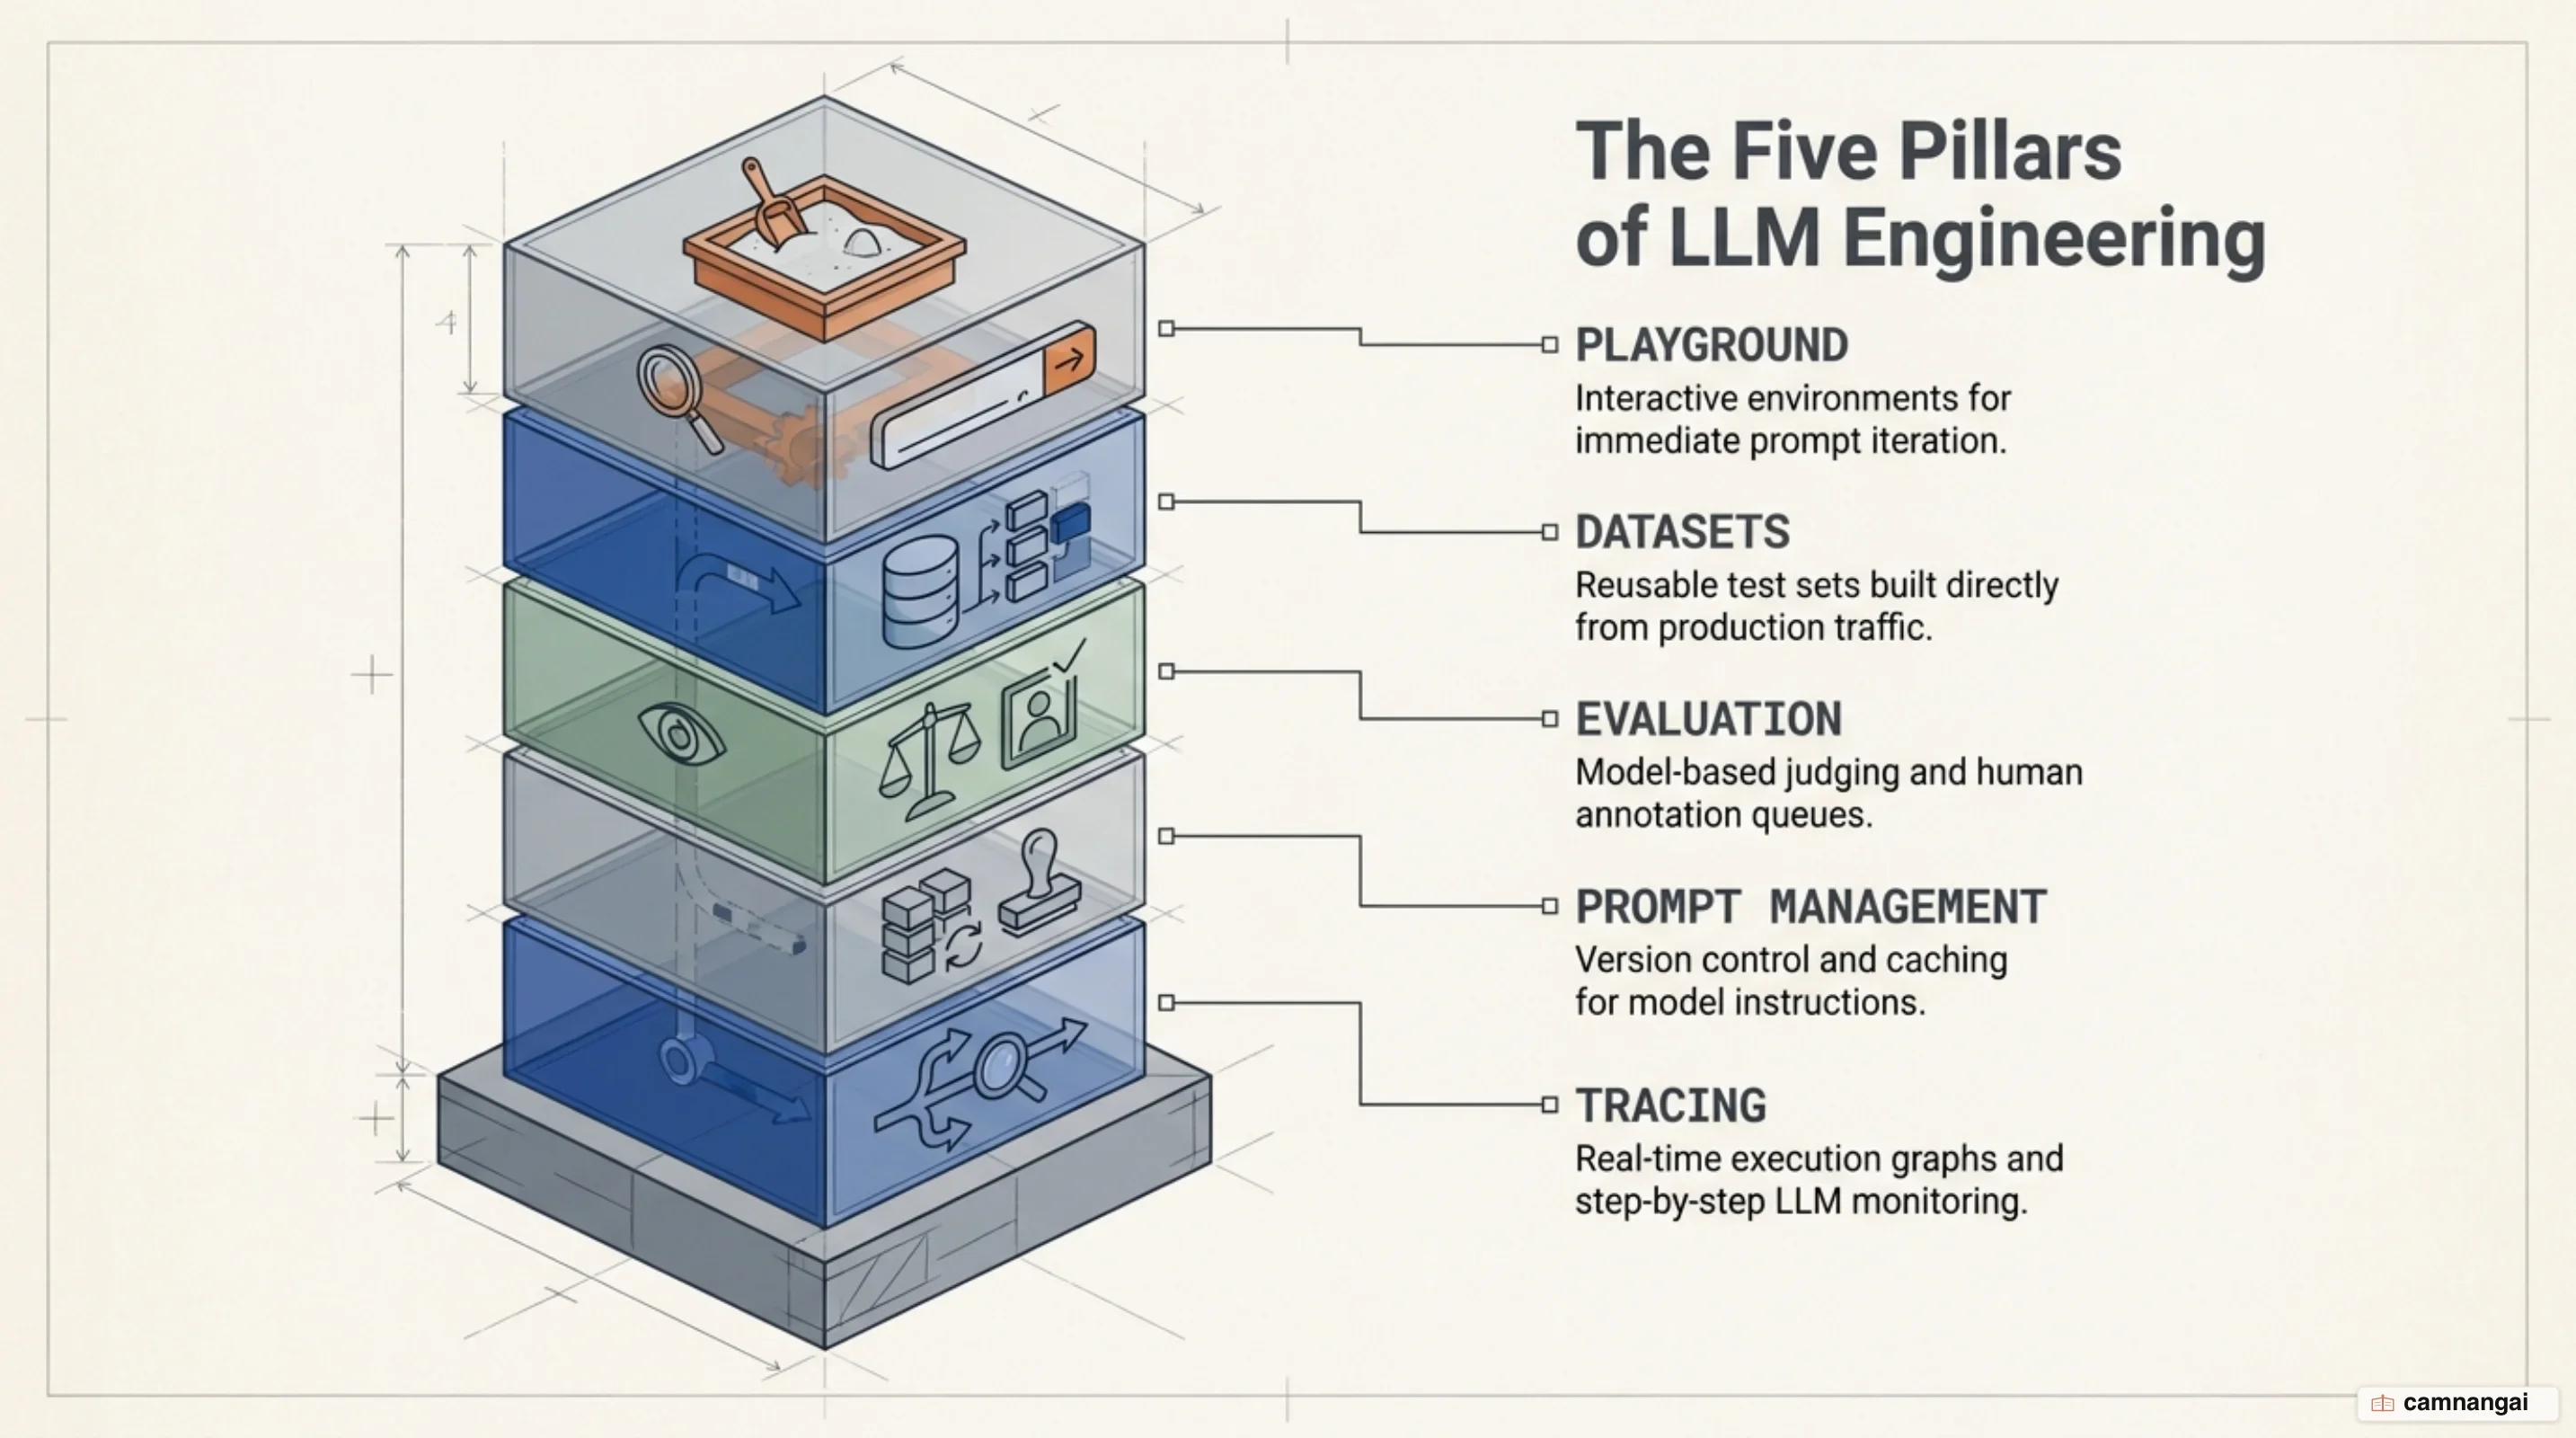
The platform has four main parts:
- Observability: structured tracing of every request, so you can see application logic and causal relationships.
- Prompt Management: a central repository for versioning, iterating on, and caching prompts.
- Evaluation: tools for scoring model outputs and catching regressions, automated or manual.
- Datasets: benchmarking for pre-deployment testing and version comparison.
Adoption backs the design. Langfuse holds more than 32,900 GitHub stars and 23.1 million SDK installs per month, and it runs in production at 63 of the Fortune 500 — including 19 of the Fortune 50, among them Merck, 7-Eleven, Intuit, Twilio, and Khan Academy.
Why do LLM applications need their own observability layer?
Traditional Application Performance Monitoring (APM) tools like Datadog and New Relic were built for
deterministic software, where success means uptime and clean error codes. With
LLMs, a trust gap opens up: an application can return a 200 OK
while delivering a factually incorrect, hallucinated, or unsafe payload. Ordinary health checks
never see it.
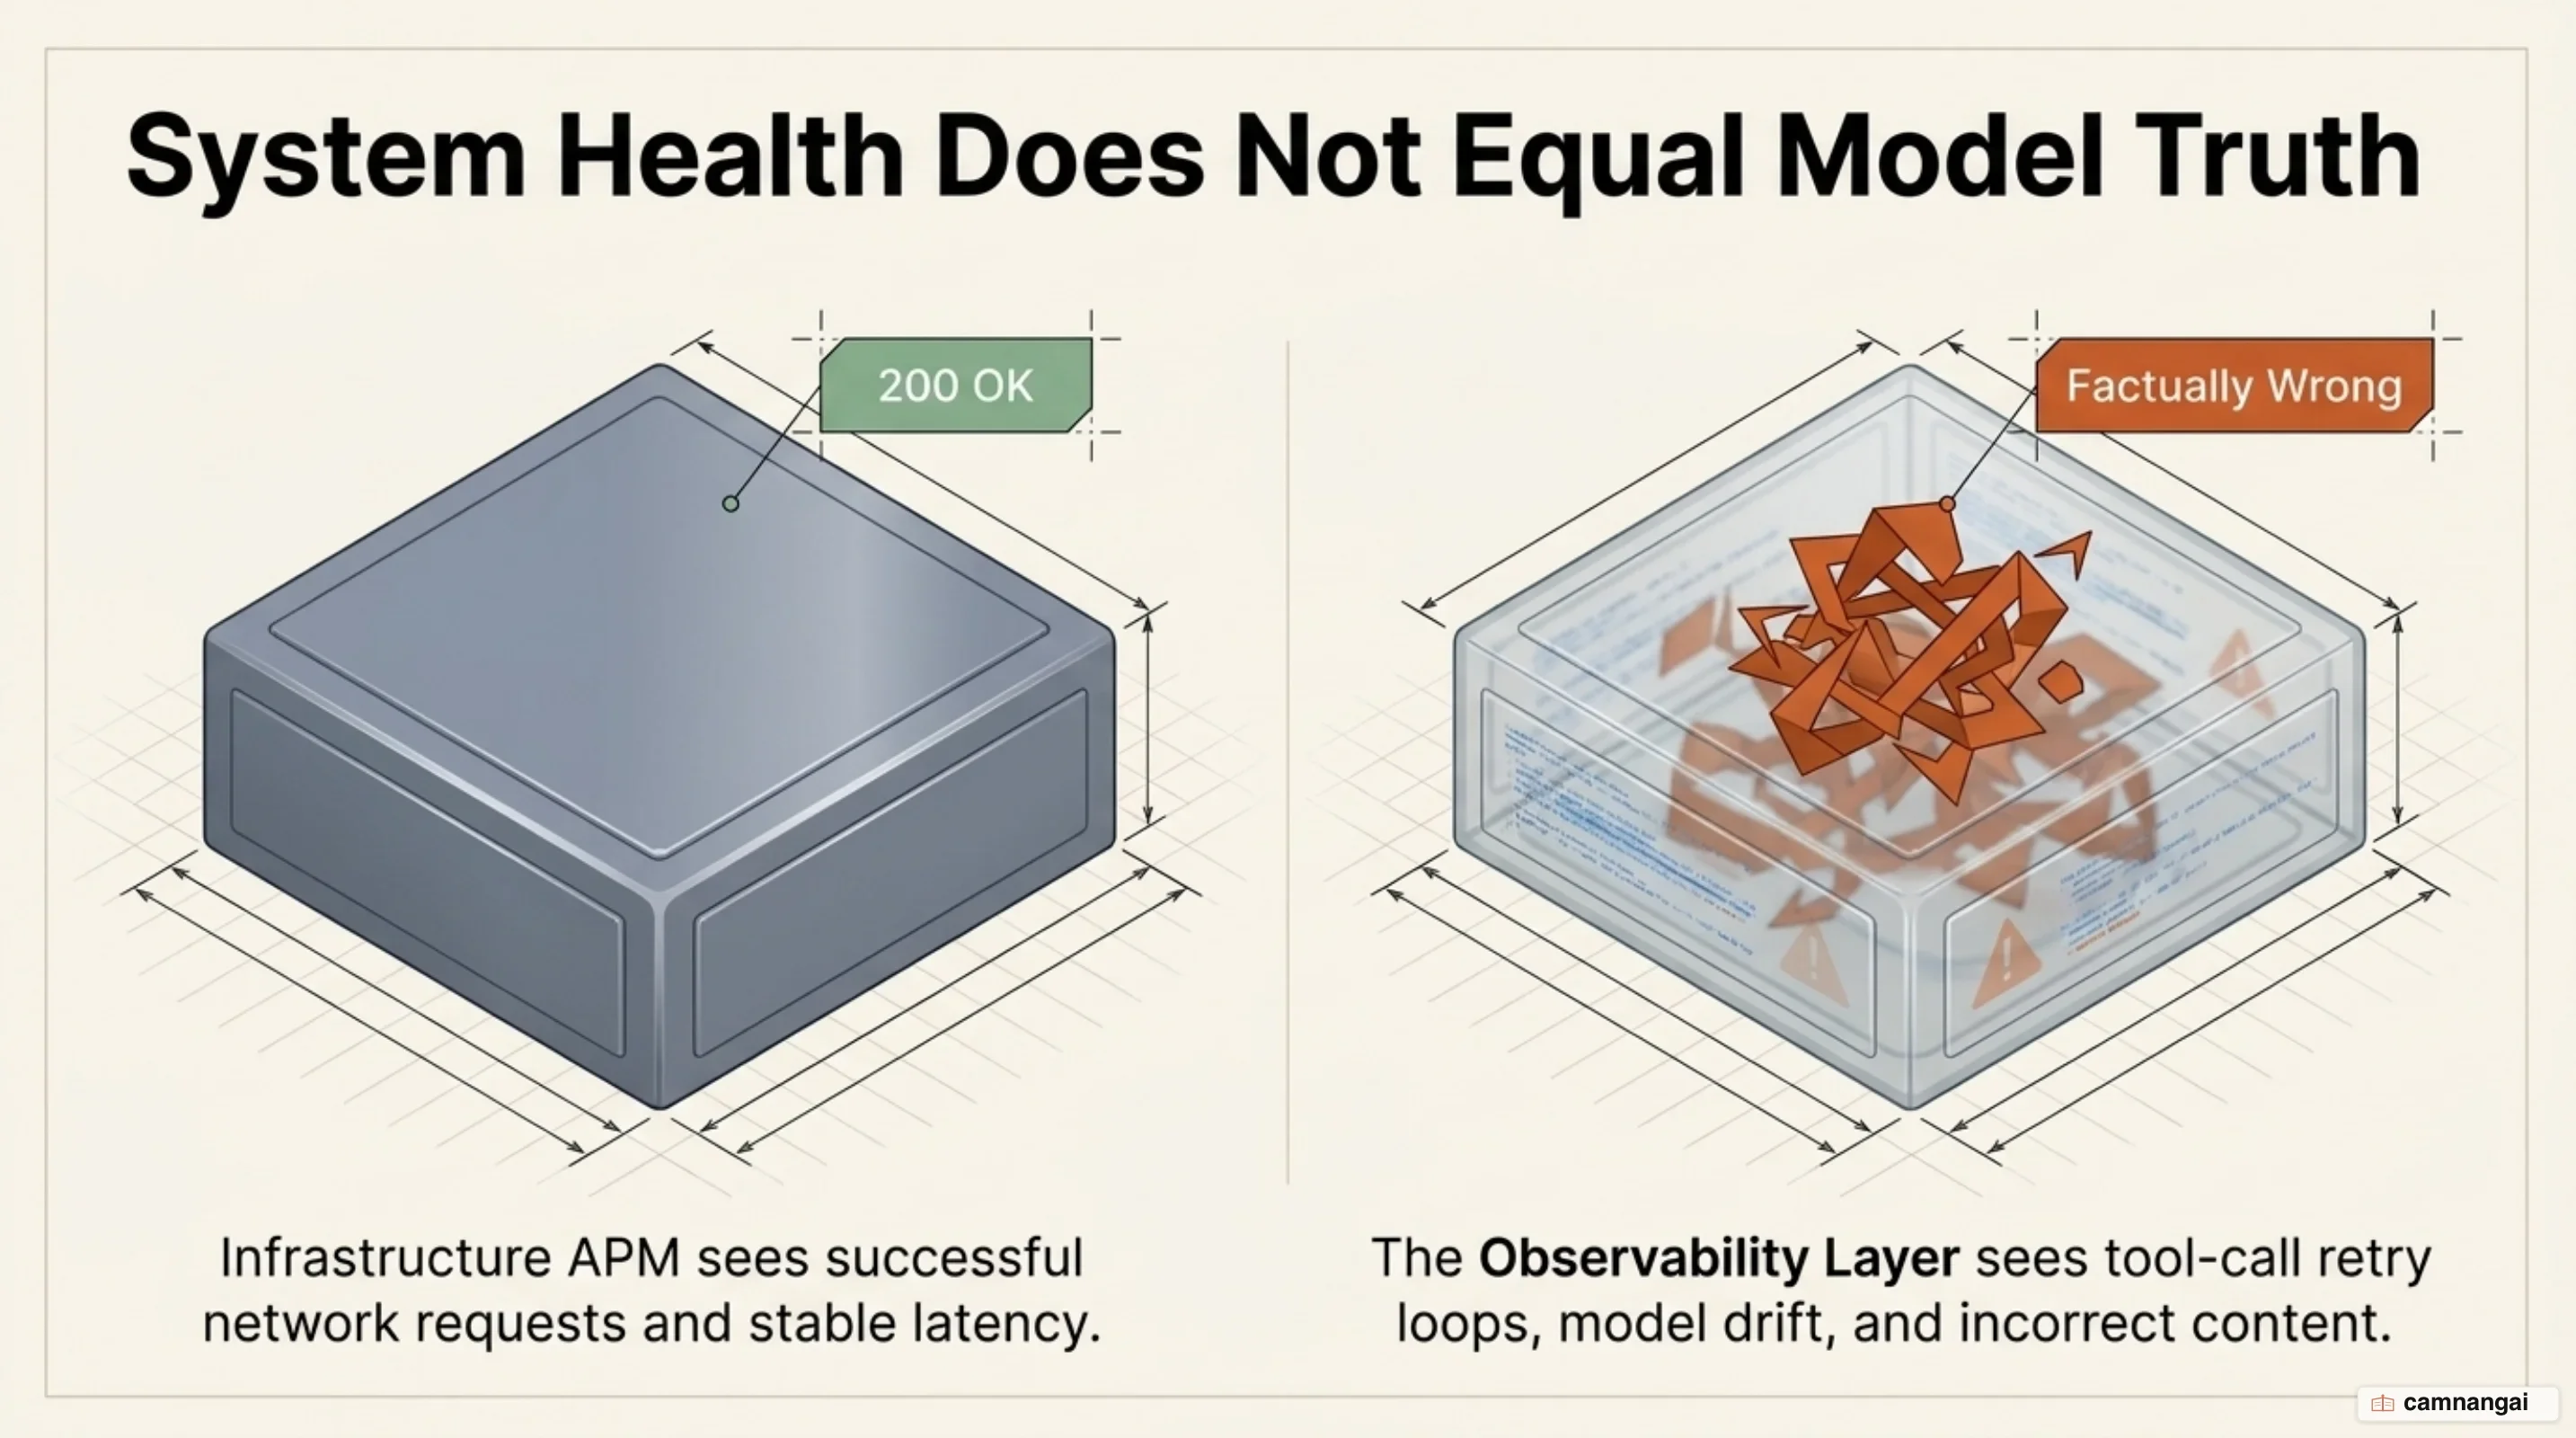
Systematic quality monitoring is what gets you past vibe-checking — manual, anecdotal testing that does not survive contact with production. AI applications fail in ways generic monitoring has no vocabulary for: model drift, tool-call retry loops that inflate costs, and prompt regressions that follow a minor framework upgrade. Catching those inside multi-step agentic workflows takes a layer that understands how nested reasoning chains relate to each other.
LLM observability records the specific context of a request — prompt templates, completions, model parameters, and token usage. With that in hand you can trace a cost spike back to a runaway agentic loop and debug execution flows that system-level logs miss. Capturing those variables turns a black-box model into something you can audit and optimize for both performance and safety.
Traces, observations and sessions: what Langfuse records
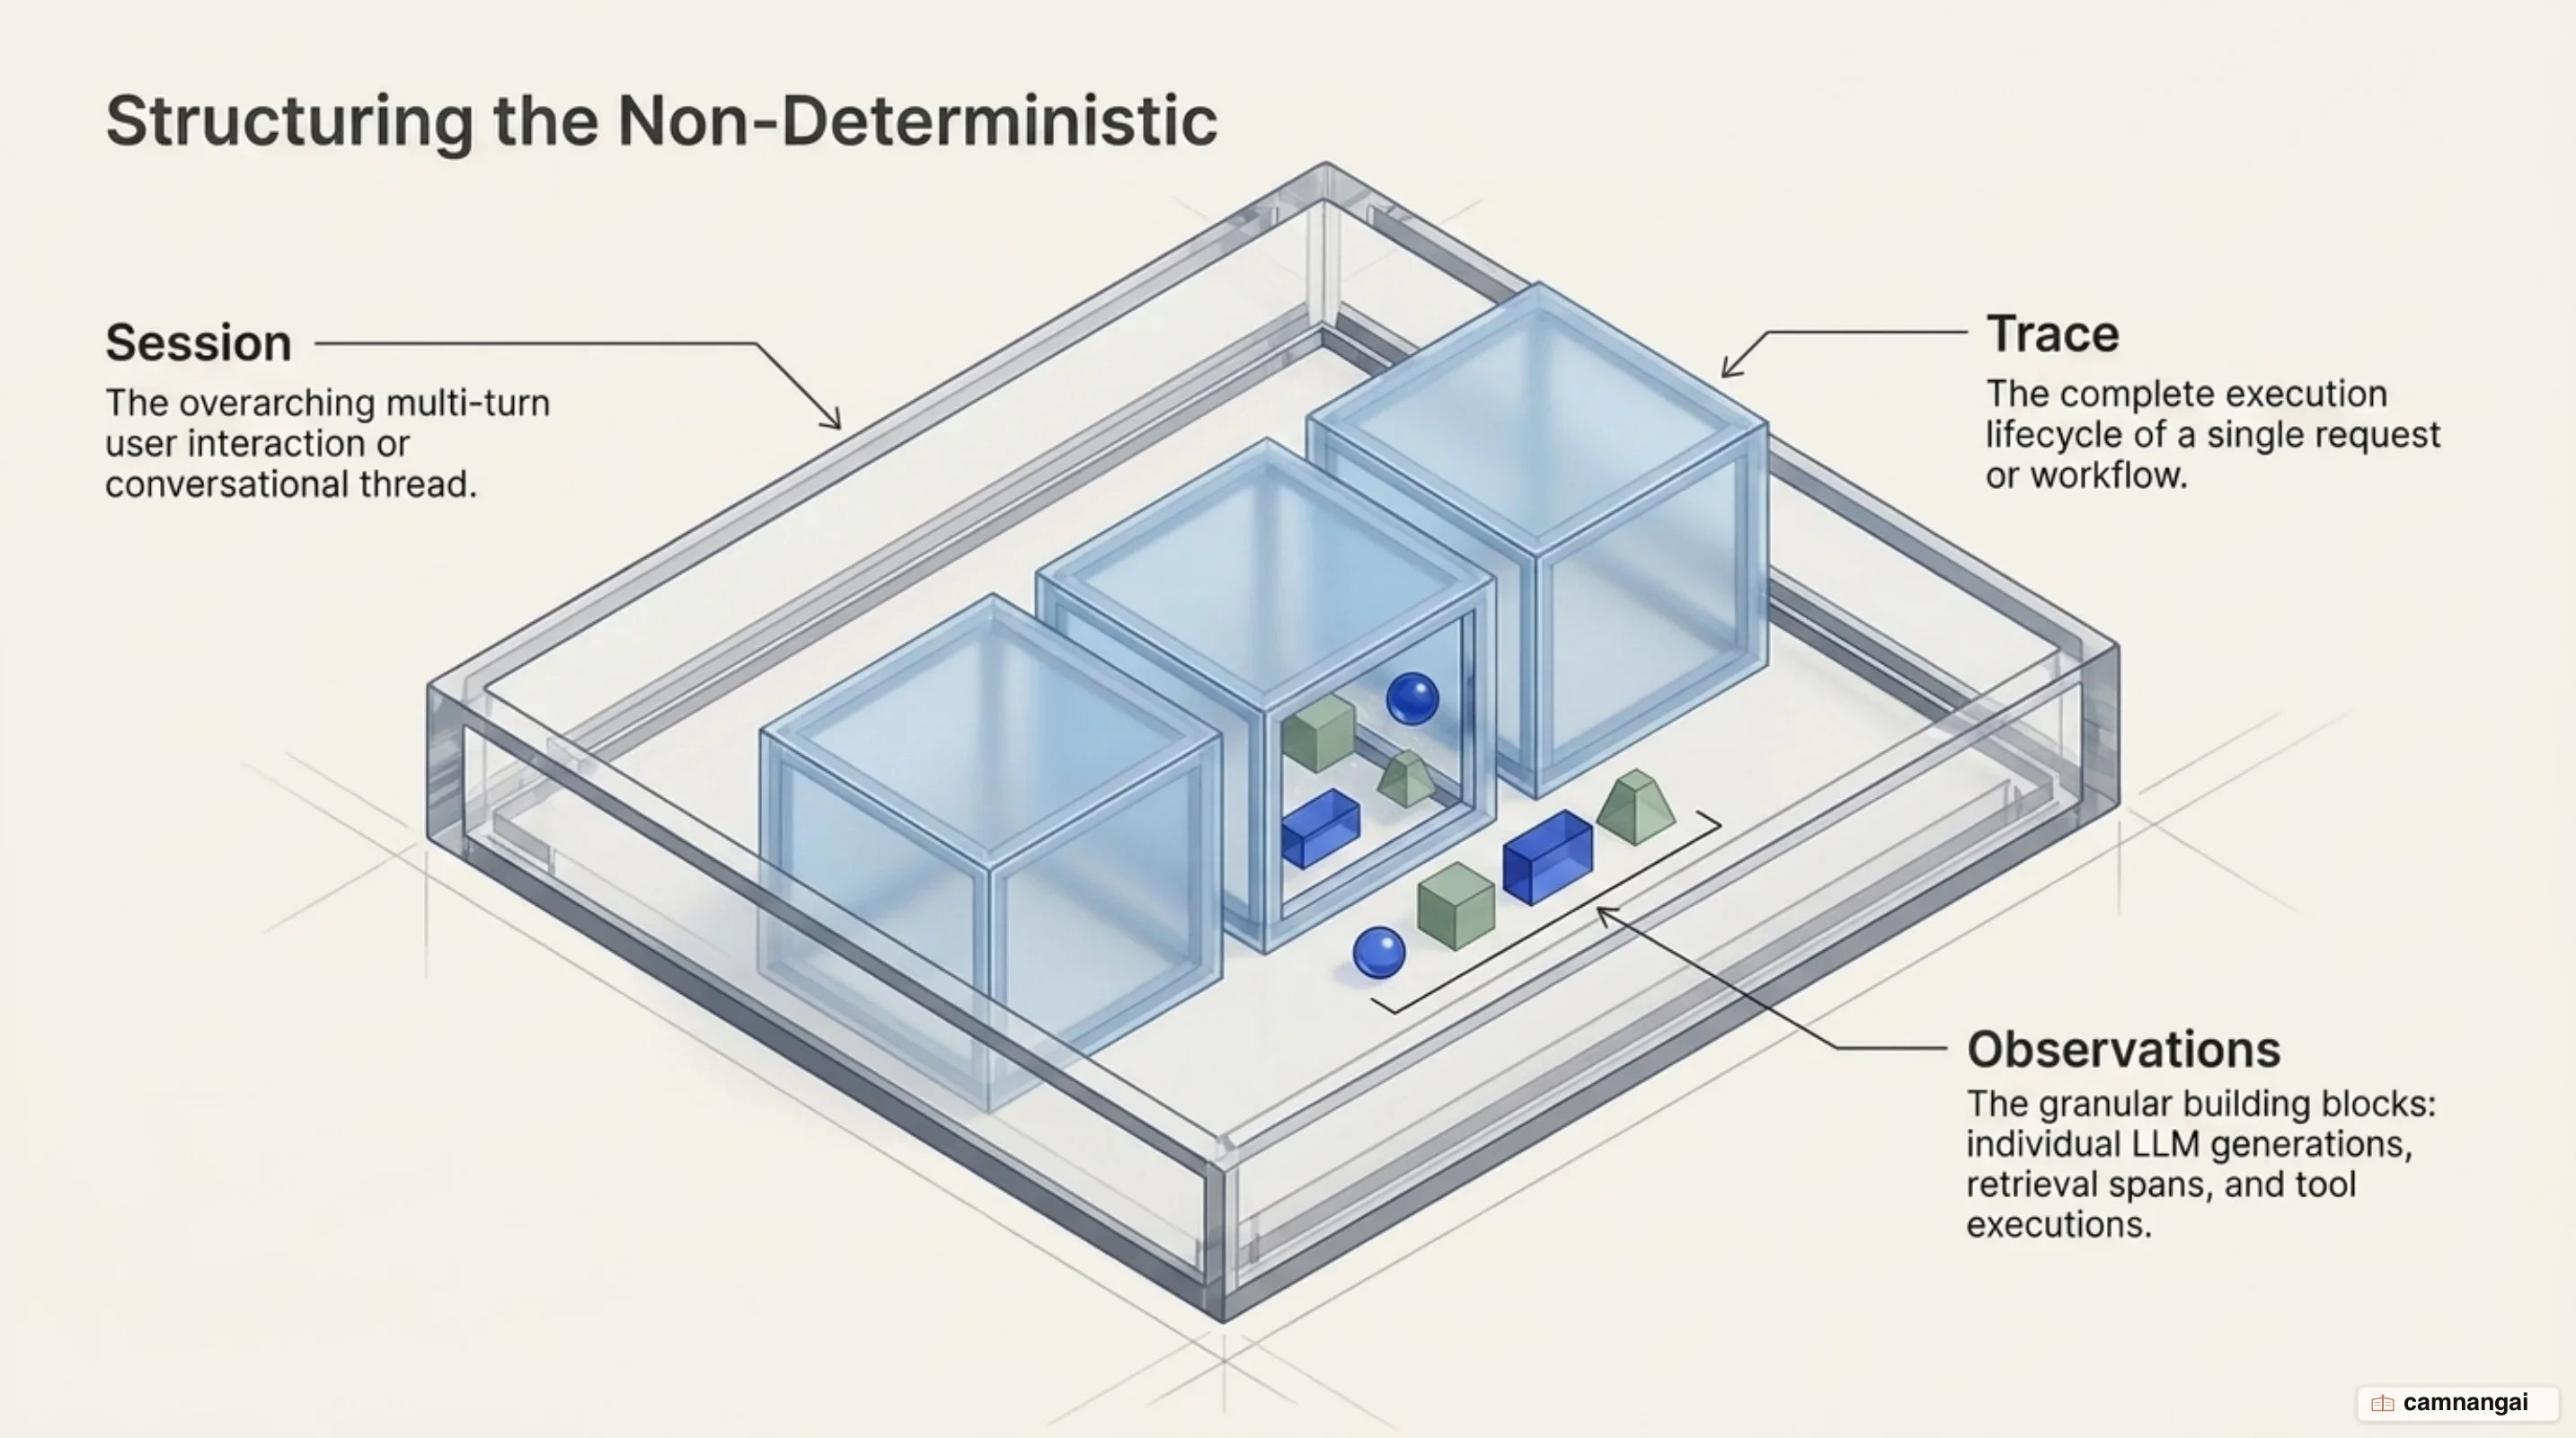
Langfuse organizes data into a hierarchy that mirrors the execution flow of an AI application:
- Traces: the complete lifecycle of a single request, from the initial user input to the final delivered response.
- Observations: the individual units of work inside a trace — spans for general work such as a retrieval step, and generations for specific calls to a model. In v4 every observation is an immutable record, which is what makes queries fast without complex joins.
- Sessions: a way to group multiple traces into one thread, such as a multi-turn conversation or a long-running agentic task.
The SDKs run asynchronously. Trace events are queued locally and flushed in batches in the background, so tracing adds no milliseconds to your main path.
Here is how to capture those structures in Python using the
@observe() decorator and the OpenAI integration:
from langfuse import observe
from langfuse.openai import openai  # drop-in replacement for the standard OpenAI client

@observe()
def story_generator():
    # Captured automatically as a 'generation': model, prompt, and completion
    return openai.chat.completions.create(
        model="gpt-4o",
        messages=[{"role": "user", "content": "Write a short technical summary."}],
    ).choices[0].message.content

@observe()
def main():
    # The parent function creates the 'trace'
    return story_generator()

main()
Evaluation and prompt management: the other half of Langfuse
Recording data is half the job. The other half is the tooling that closes the quality loop.
Prompt management
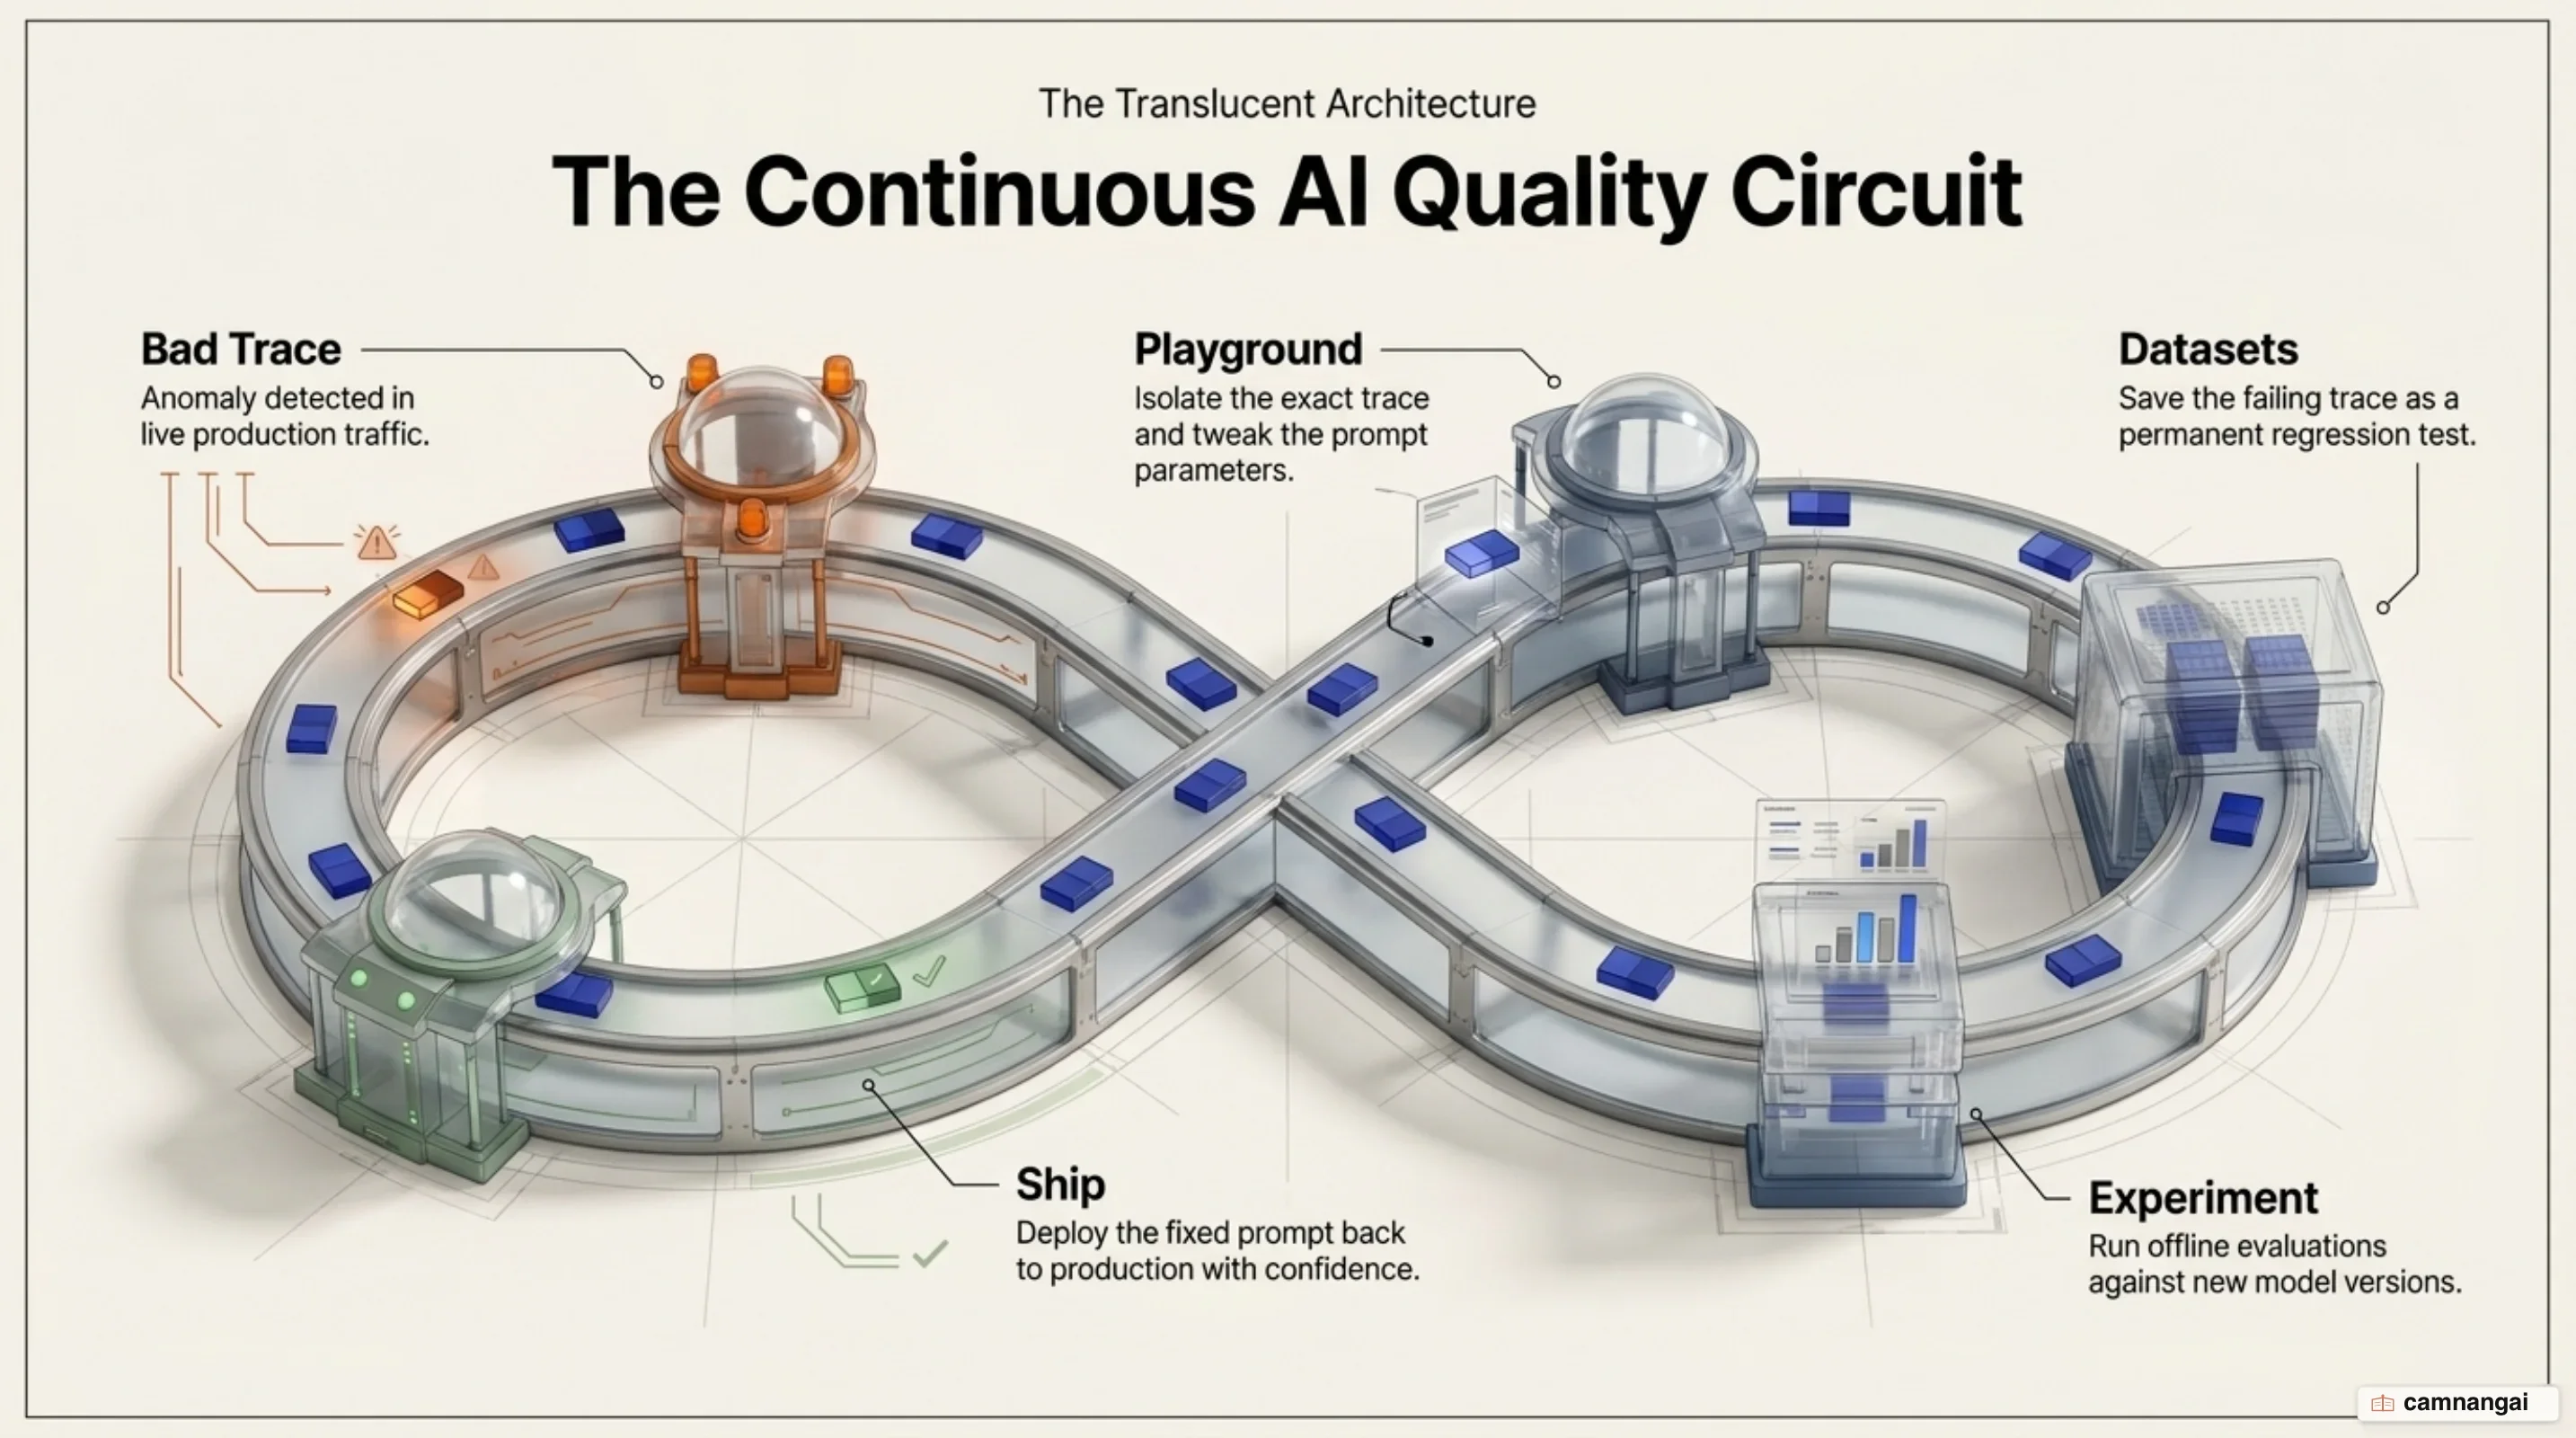
Rather than hard-coding prompts into your source, you manage them in Langfuse. Server-side and client-side caching means you can iterate on a prompt in the Playground and ship the change without a redeploy, which cuts both risk and latency — and trims provider costs along the way.
Evaluation methods
- Automated: deterministic code evaluators check specific conditions, such as valid JSON schema or the absence of forbidden keywords. LLM-as-a-judge uses a model to score another model's output on metrics like hallucination or helpfulness.
- Manual: annotation queues give human reviewers a structured interface for rating traces on accuracy.
- End-user feedback: thumbs up and down collected from real users, folded into the same quality metrics.
Playground and datasets
When a trace comes back bad, push it straight into the Playground to tune the prompt. Save the case into a dataset, then run an experiment to compare model and prompt versions side by side before anything ships.
Self-hosted or cloud?
The choice comes down to data residency, scale, and how much of the stack you want to own.
Langfuse Cloud is tiered by volume and retention:
- Hobby: free, 50k units per month, 30 days of data access. Enough for a proof of concept.
- Core ($29/mo): 100k units, 90 days of data access, unlimited users.
- Pro ($199/mo): 100k units, 3 years of data access, SOC2 and ISO27001 reports, BAA available for HIPAA.
- Enterprise ($2,499/mo): uptime SLA, audit logs, SCIM API, and a dedicated support engineer.
- Teams Add-on ($300/mo): layered onto Pro or Enterprise for enterprise SSO (Okta, for example), SSO enforcement, and fine-grained RBAC.
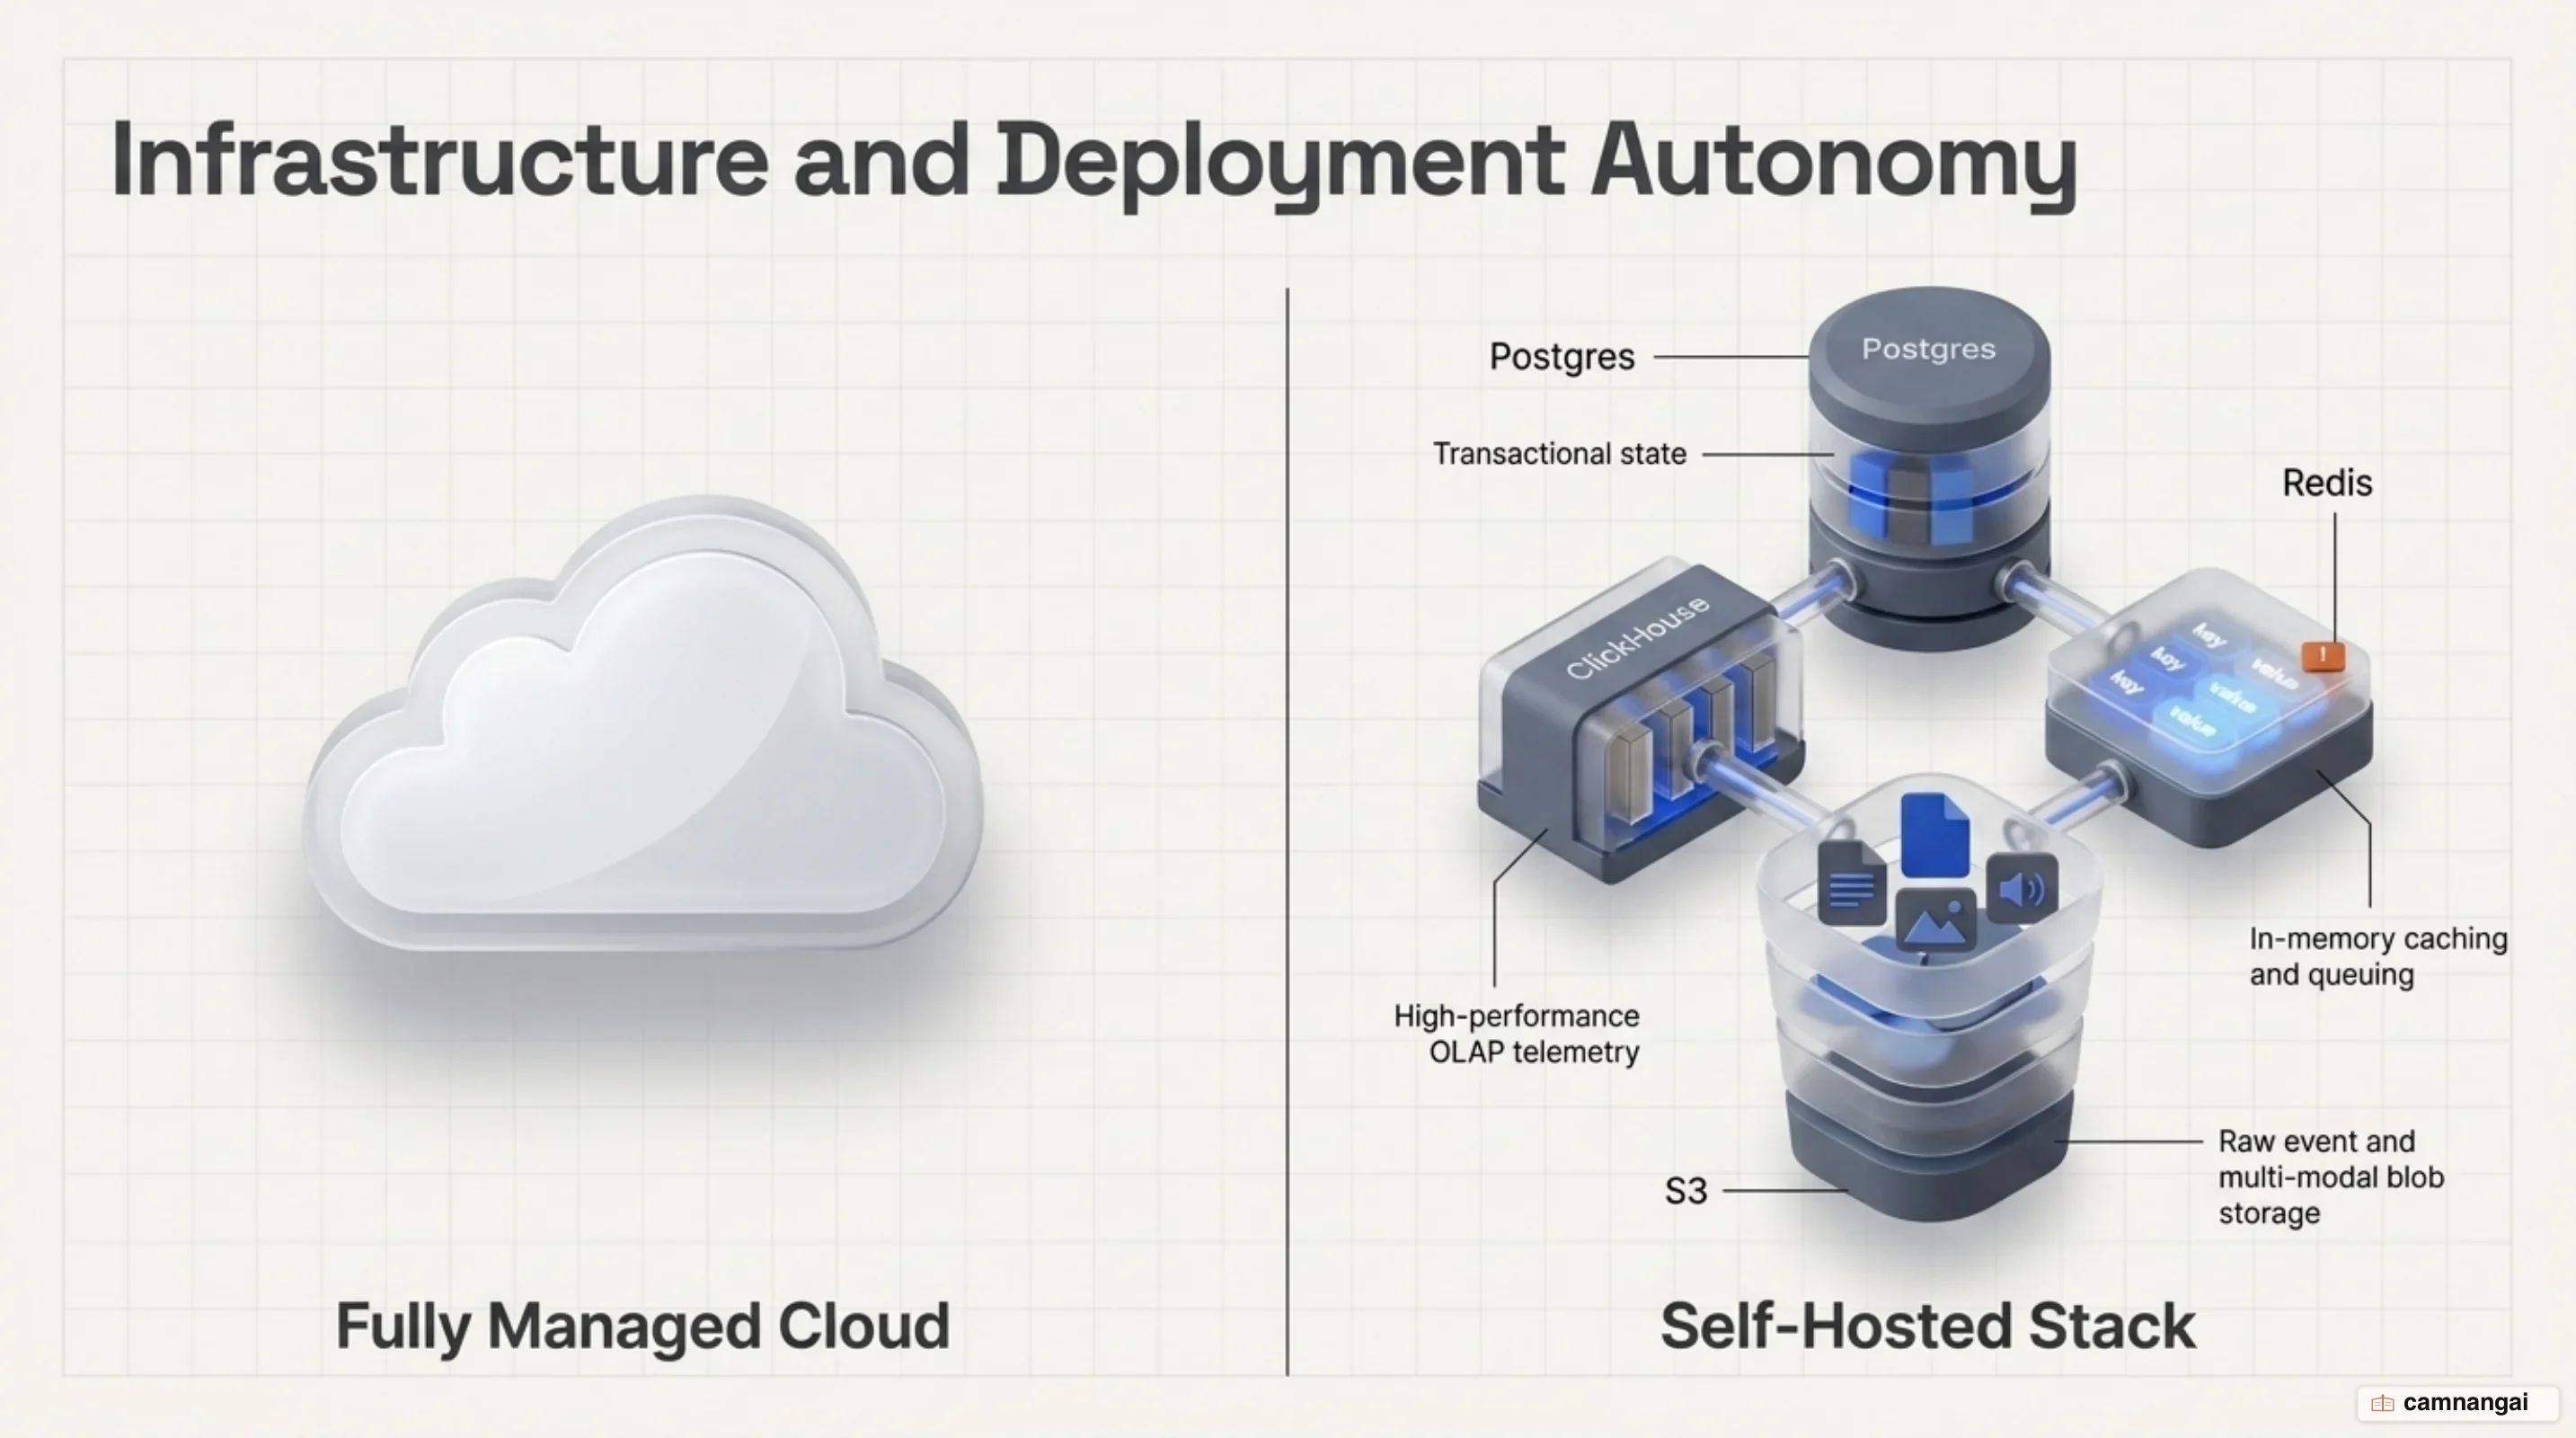
Self-hosting runs on a Postgres and ClickHouse stack, plus Redis/Valkey for queues and S3-compatible blob storage. The core is MIT-licensed, so there is no platform fee — you pay for compute and storage only — though some enterprise add-ons still require a license key. For organizations with strict data residency requirements, this is effectively the only option.
For a small-scale deployment, Docker Compose is enough:
git clone https://github.com/langfuse/langfuse.git
cd langfuse
docker compose up
At production scale you move to Kubernetes via Helm, or Terraform on AWS, Azure, and GCP.
Langfuse under ClickHouse: v4 and what changed
Langfuse v4 shifted the platform to an observations-first data model, built to handle the scale
modern agentic systems produce. Trace-level attributes such as user_id and session_id are copied
onto every row of the immutable observations table — denormalization — which removes the need for
costly joins at read time.
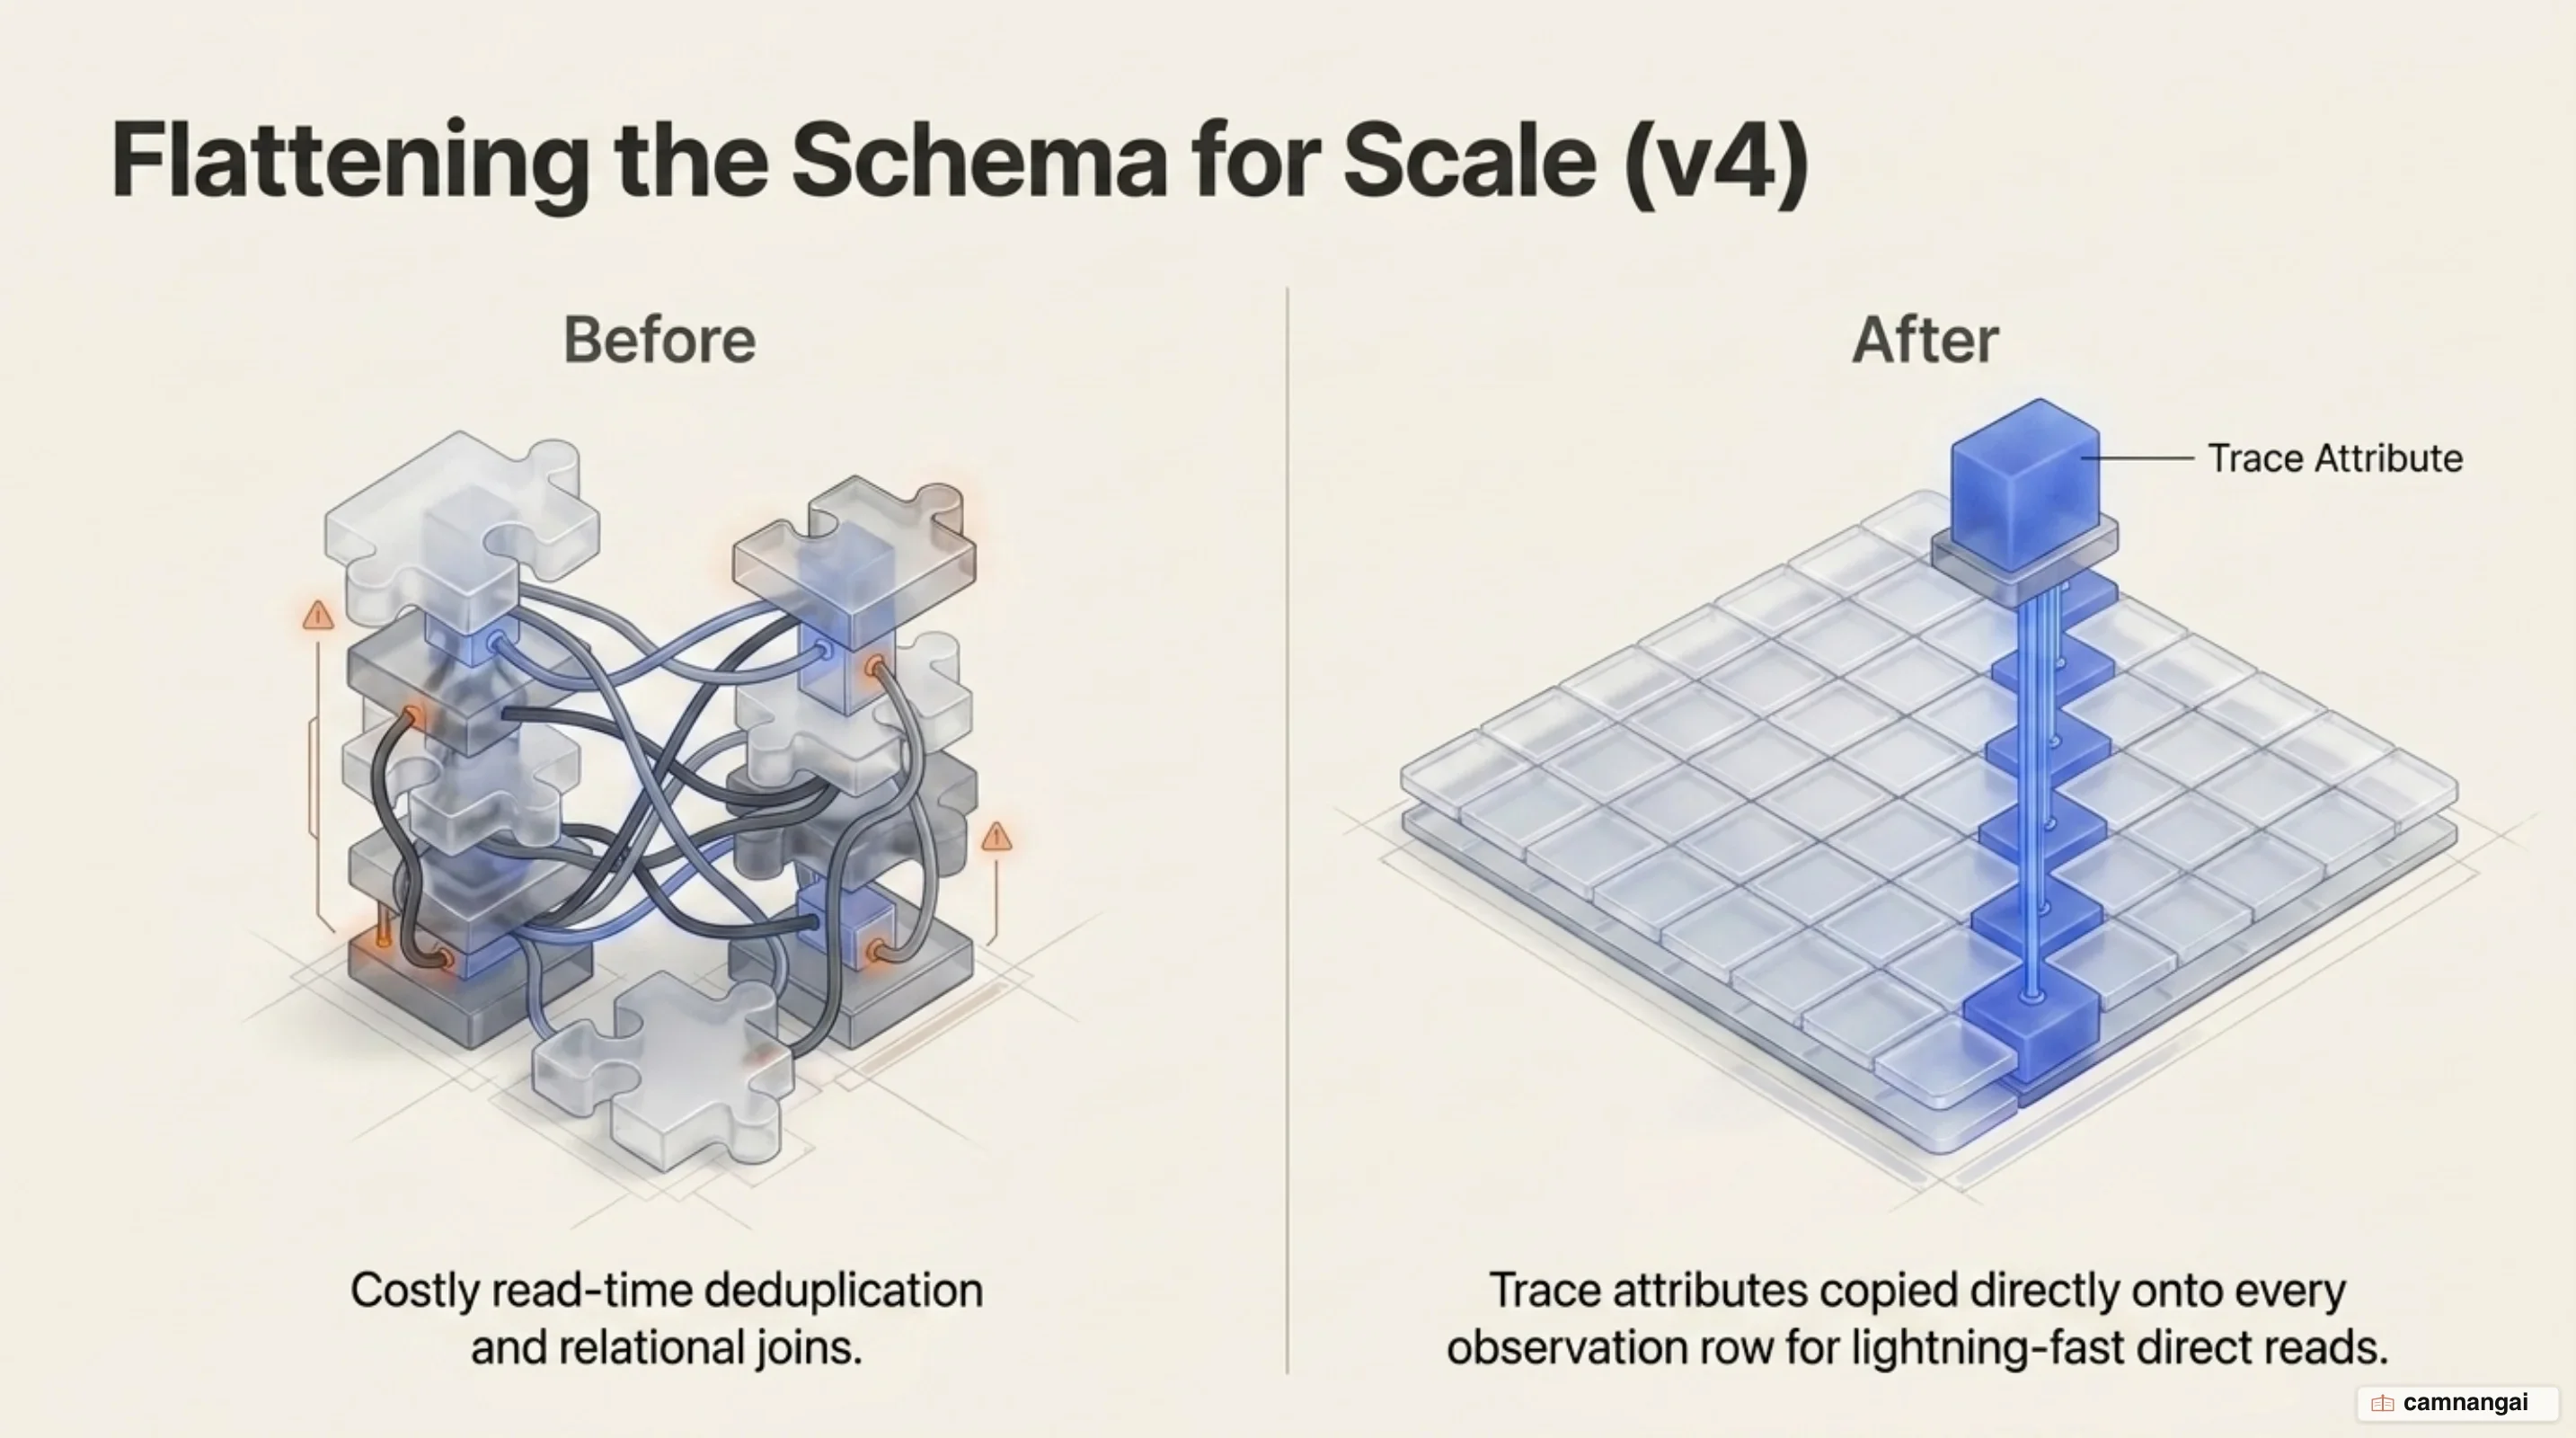
Dashboard load times for large projects improve by at least 10x. The observations-first approach also eliminates read-time deduplication, a familiar bottleneck in high-volume tracing systems. New capabilities follow from it: full-text search across all inputs and outputs, alerts on application metrics, and considerably faster Observations API v2 and Metrics API v2.
On timing, organizations created on or after 14 April 2026 run v4 by default, and v4 is now generally available for self-hosted deployments. ClickHouse has committed to keeping the Langfuse core under its MIT license, so the community keeps access to the observability features that matter most.
When is Langfuse the right choice?
Langfuse is the right pick when you need a framework-agnostic, OpenTelemetry-compatible platform, or when data residency requirements force you to self-host. If your stack is exclusively LangChain and LangGraph, LangSmith offers deeper graph-level integration; if your team comes from an ML background and needs statistical rigor and drift detection, Arize Phoenix will feel more familiar.
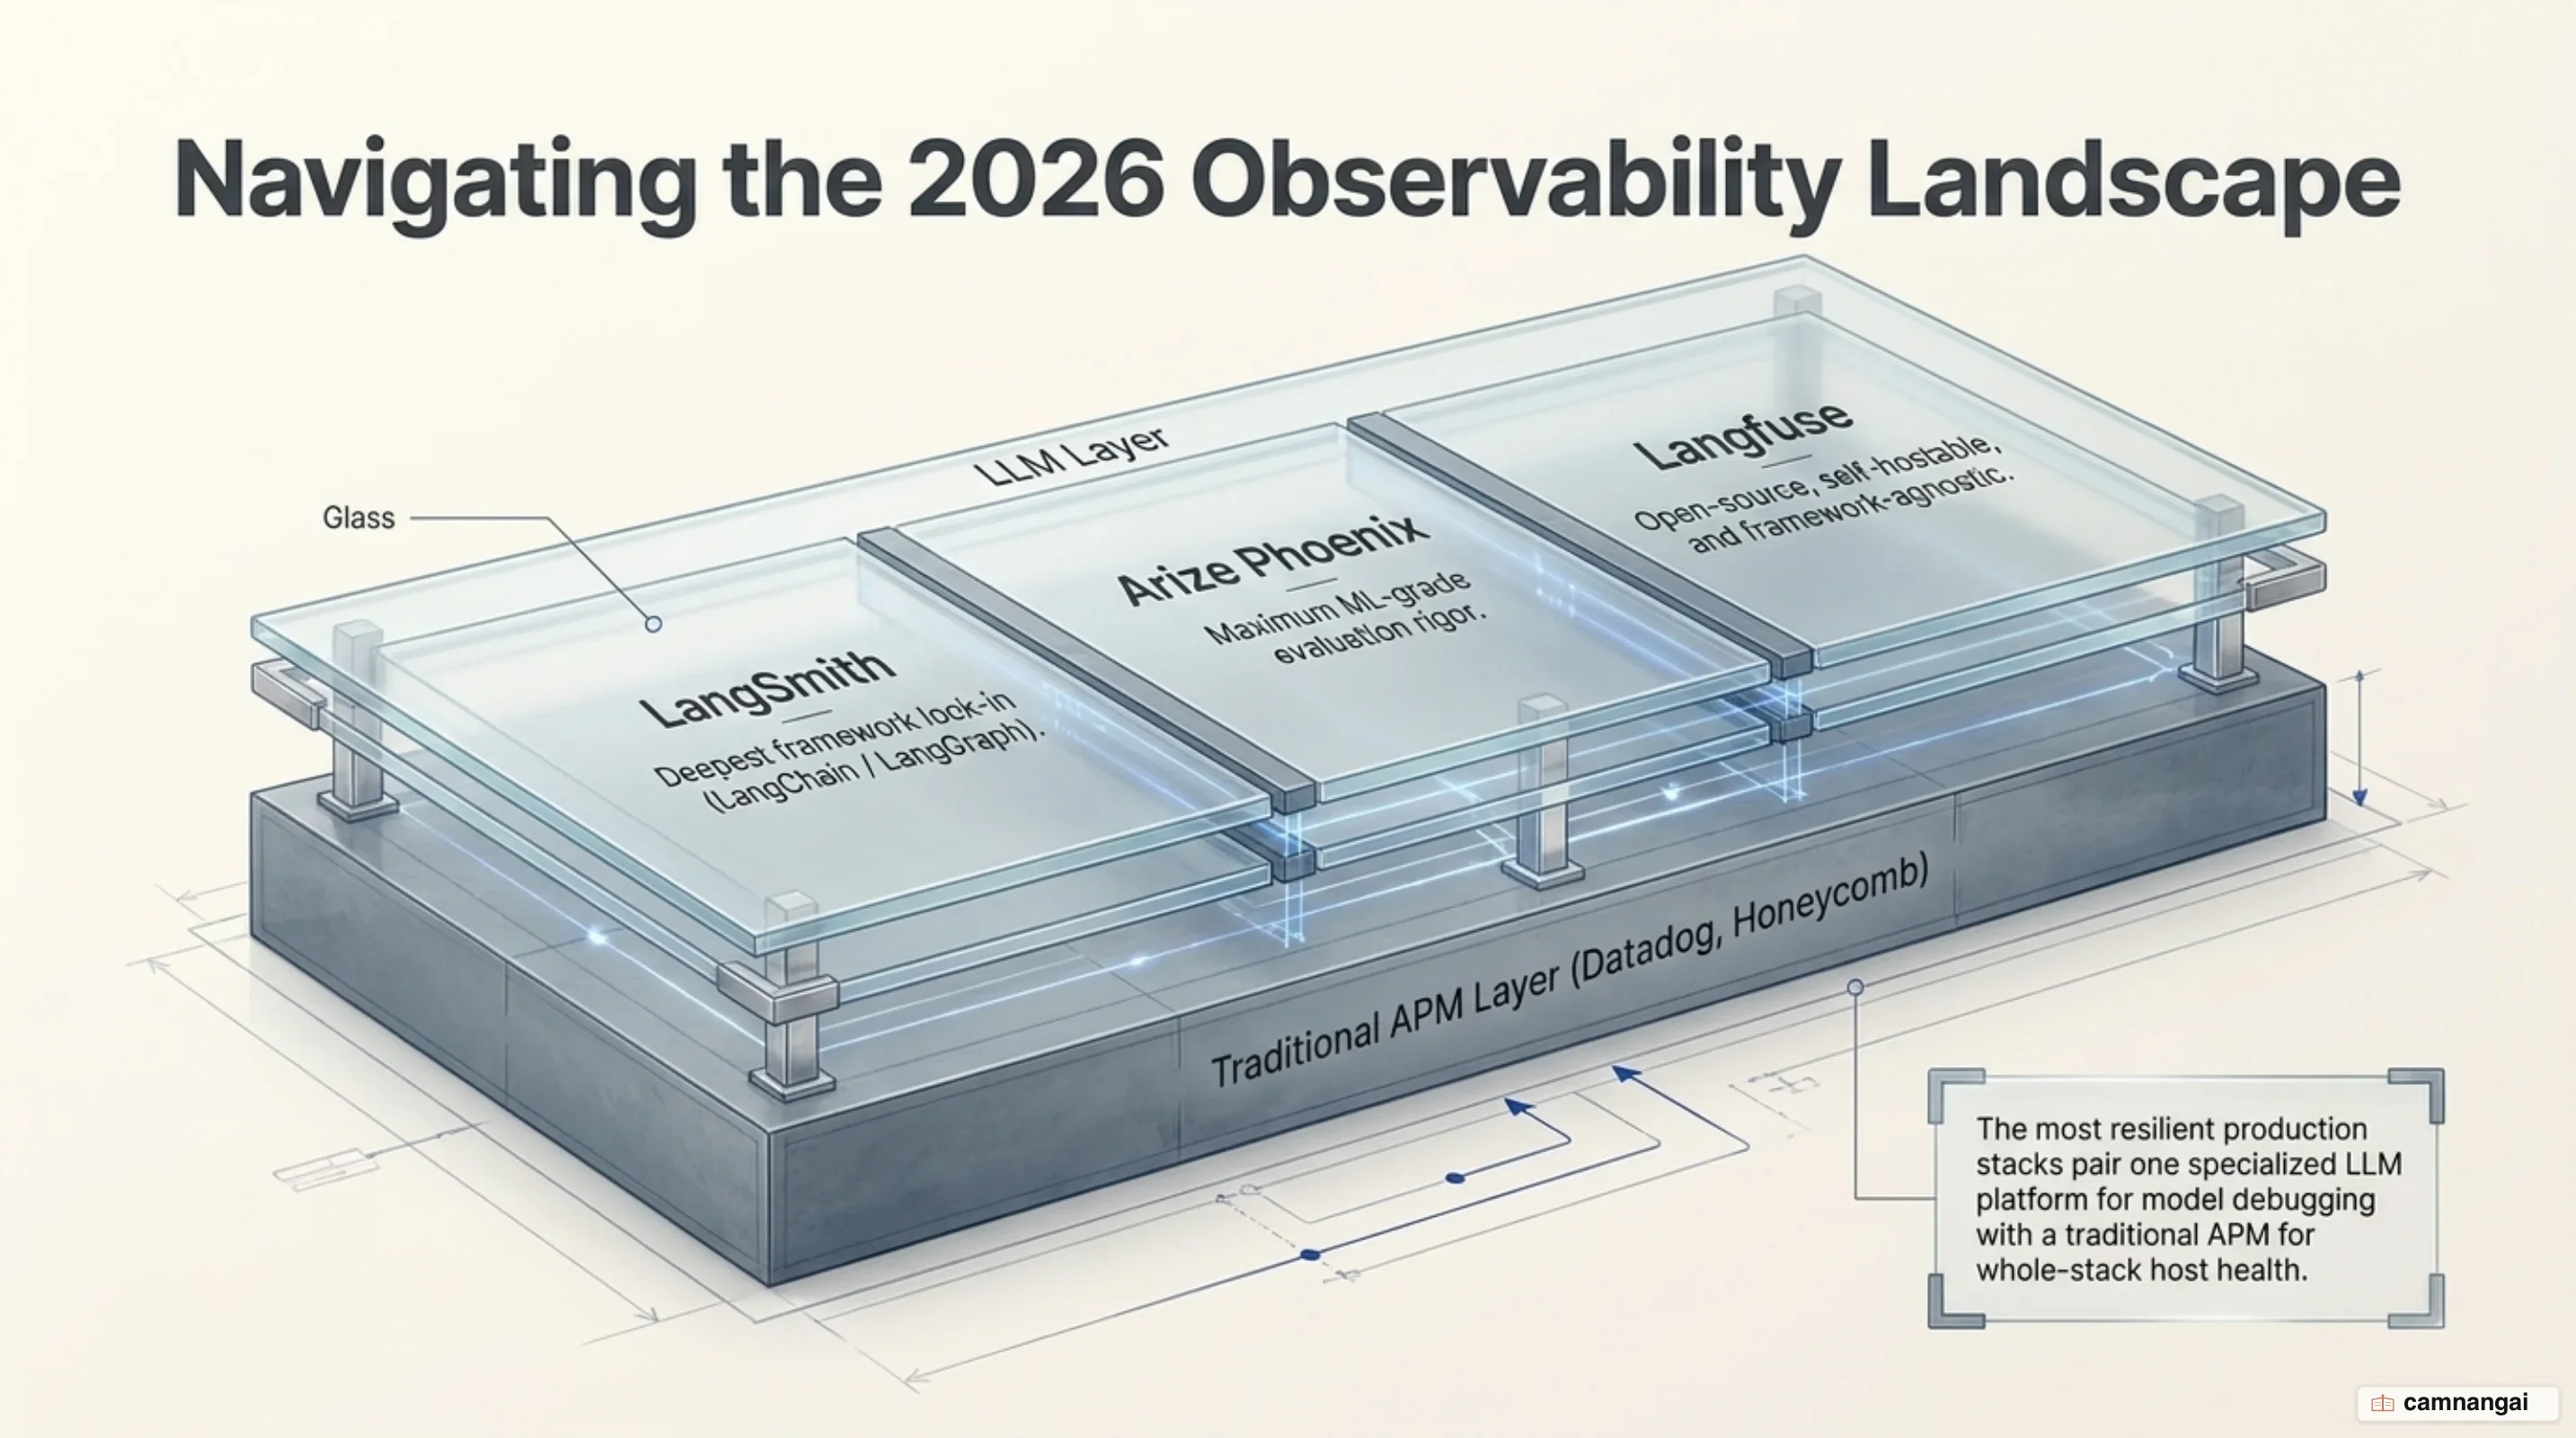
For production systems, layer rather than choose. Run Langfuse for the AI engineering layer — traces, evals, prompt management — and pair it with a traditional APM like Datadog for full-stack infrastructure health. The two answer different questions, and you need both answers.
References
- LLM Observability & Application Tracing (Open Source) — Langfuse
- Evaluation of LLM Applications — Langfuse
- Self-host Langfuse (Open Source LLM Observability) — Langfuse
- Pricing — Langfuse
- Langfuse v4 is live — Langfuse
- GitHub — langfuse/langfuse: Open source AI engineering platform
- ClickHouse welcomes Langfuse: The future of open-source LLM observability — ClickHouse
- Agent Observability Platforms: LangSmith, Langfuse, Arize 2026 — Digital Applied
- Transform Large Language Model Observability with Langfuse — AWS Partner Network Blog