On October 8, 2026, Anthropic launched Claude Dashboards and Claude Motion in beta. Claude Dashboards enables you to run natural-language prompts that execute live SQL queries directly against connected enterprise data warehouses and CRM systems. Claude Motion allows you to generate editable, code-driven visual animations exported as MP4s without using generative video footage or synthetic humans.
Both features sit inside Anthropic's Artifacts workspace framework. Alongside this beta release, existing workplace productivity templates—including Docs, Slides, and Design—have moved out of beta and are generally available across all service plans.
By providing direct query visibility and programmatic visual rendering, these tools allow your team to move from static reporting to real-time data exploration and dynamic visual presentation within a single interface.
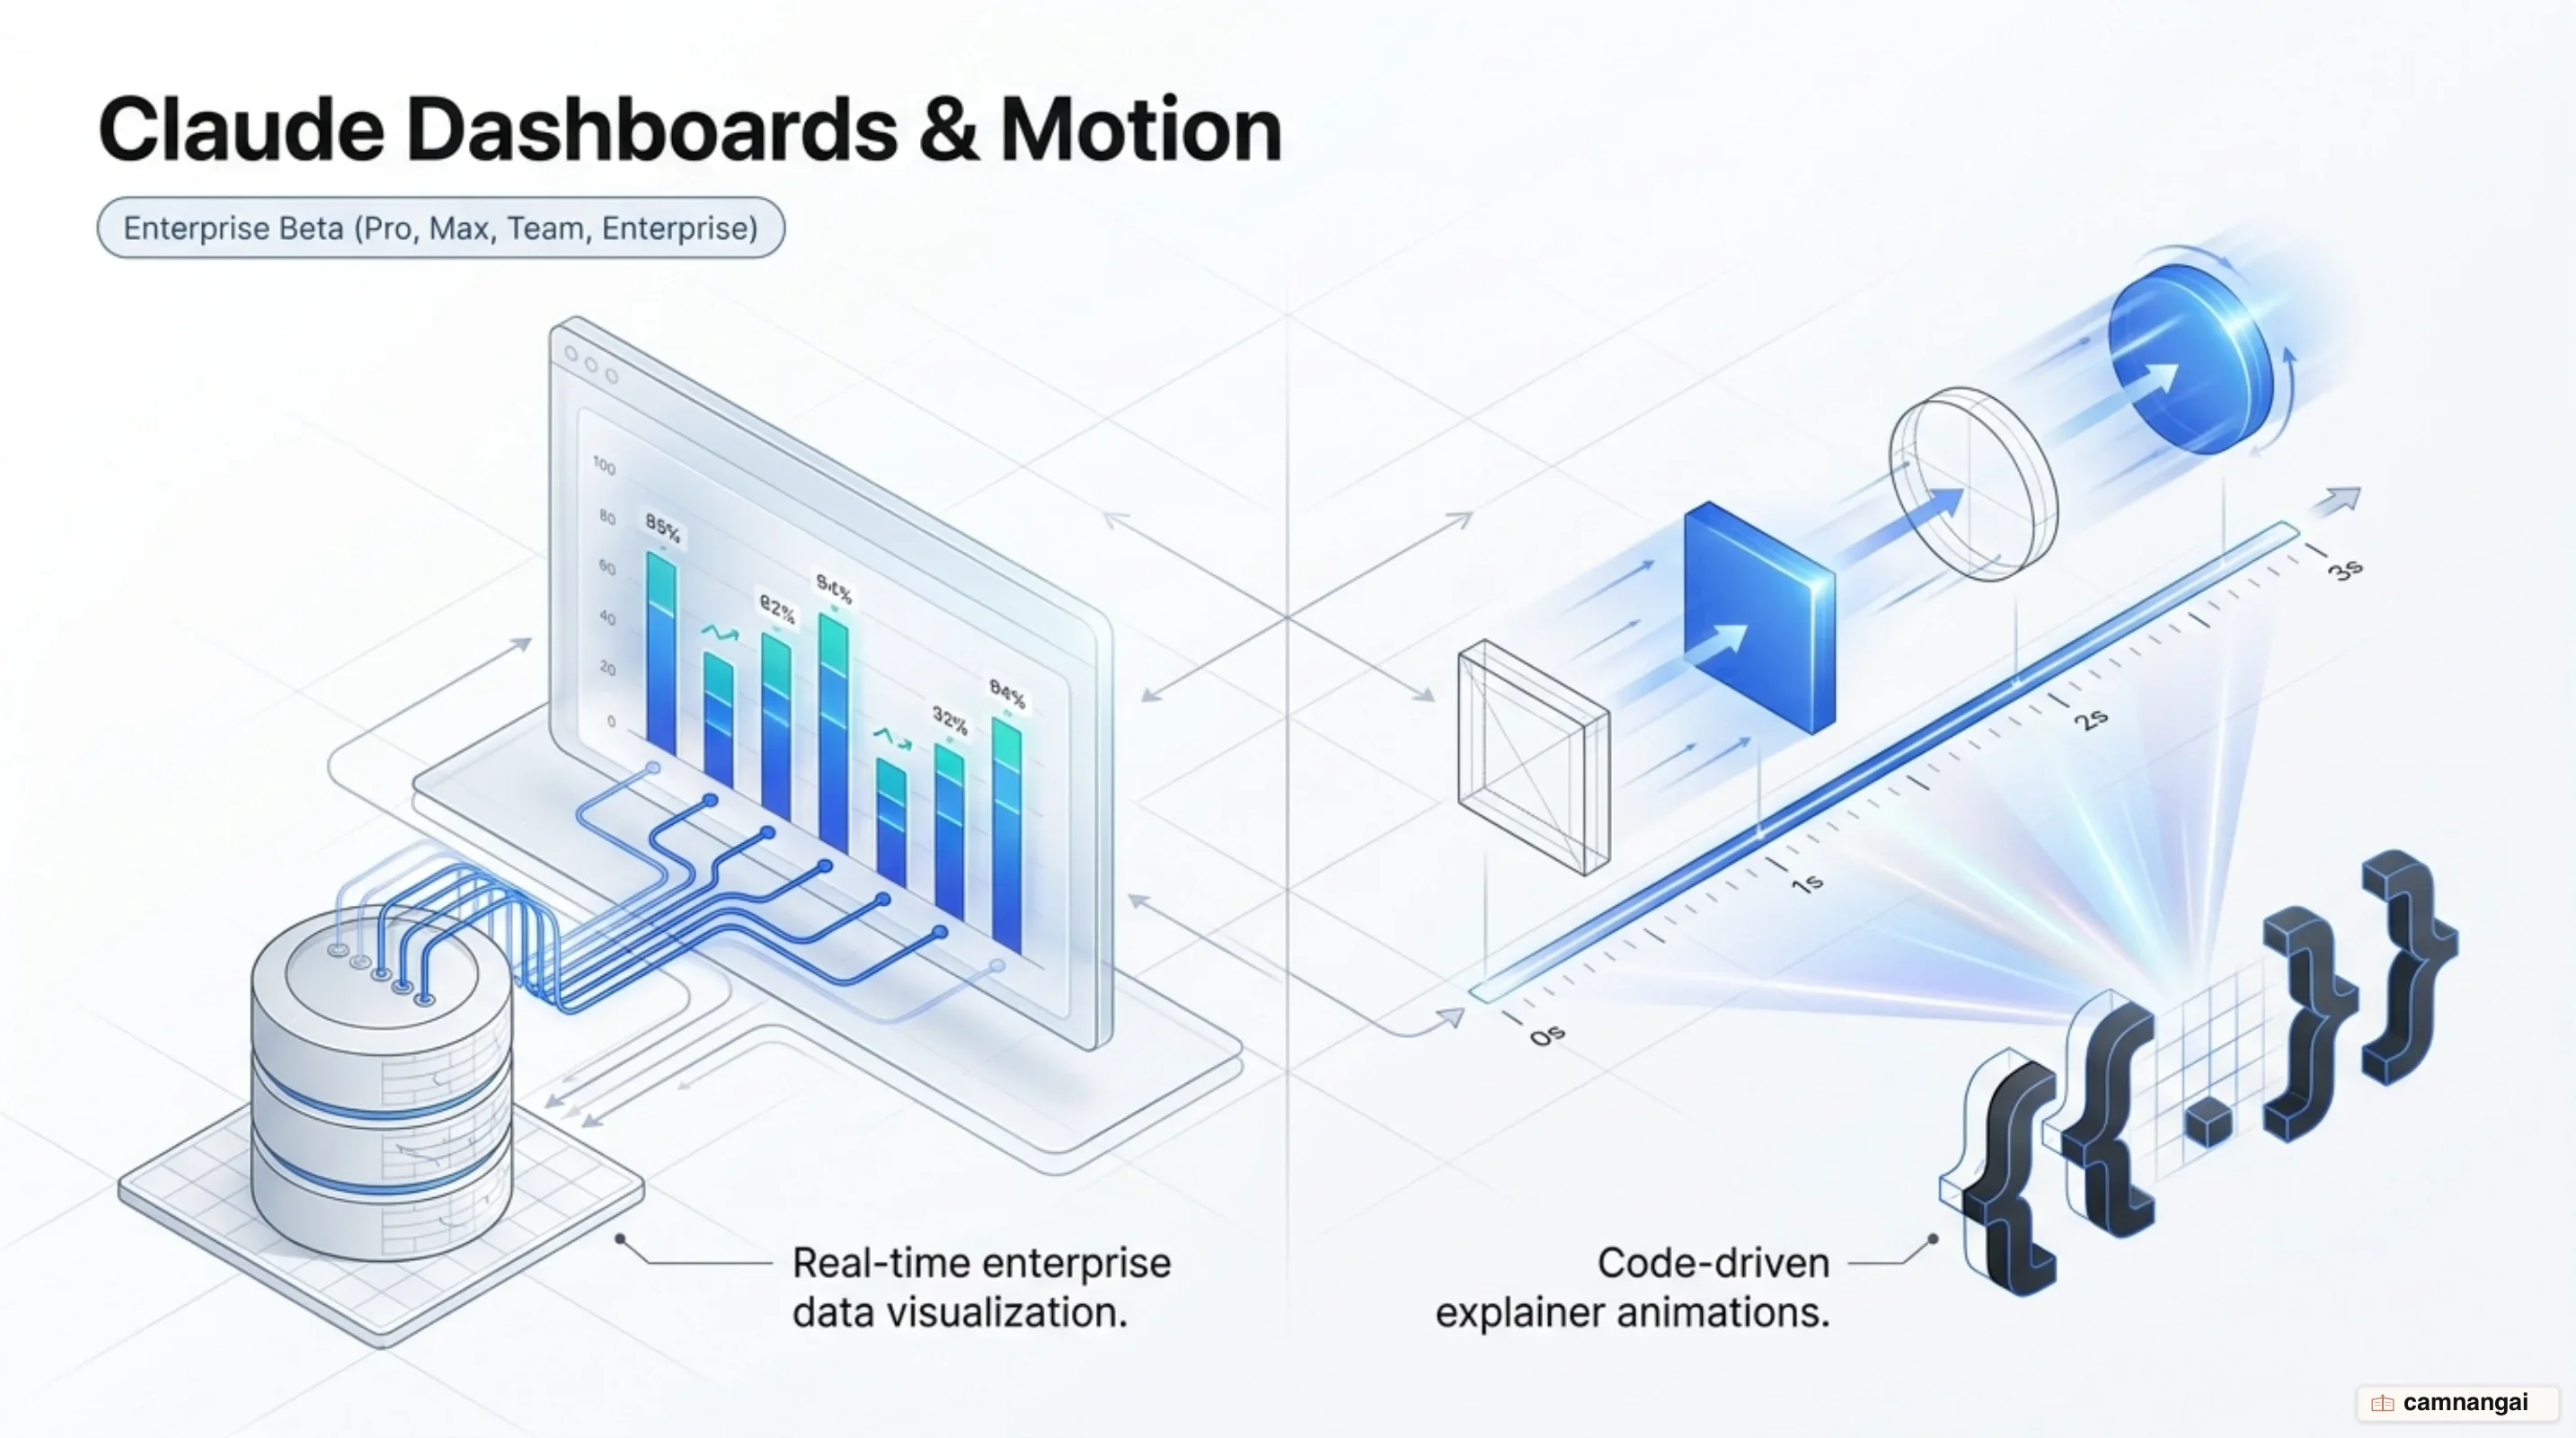
Claude Dashboards: Natural Language Queries for Enterprise Warehouses
You can connect Claude Dashboards directly to enterprise data platforms, including Amazon Redshift, BigQuery, ClickHouse, Databricks, and Snowflake, as well as business applications like Salesforce. When you enter a prompt in plain language, Claude translates the request into an underlying SQL query, executes it against the connected database using your authenticated user credentials, and renders the result as an interactive dashboard artifact. The resulting visuals update automatically as the underlying warehouse data changes, with each component displaying the precise timestamp of its most recent data refresh.
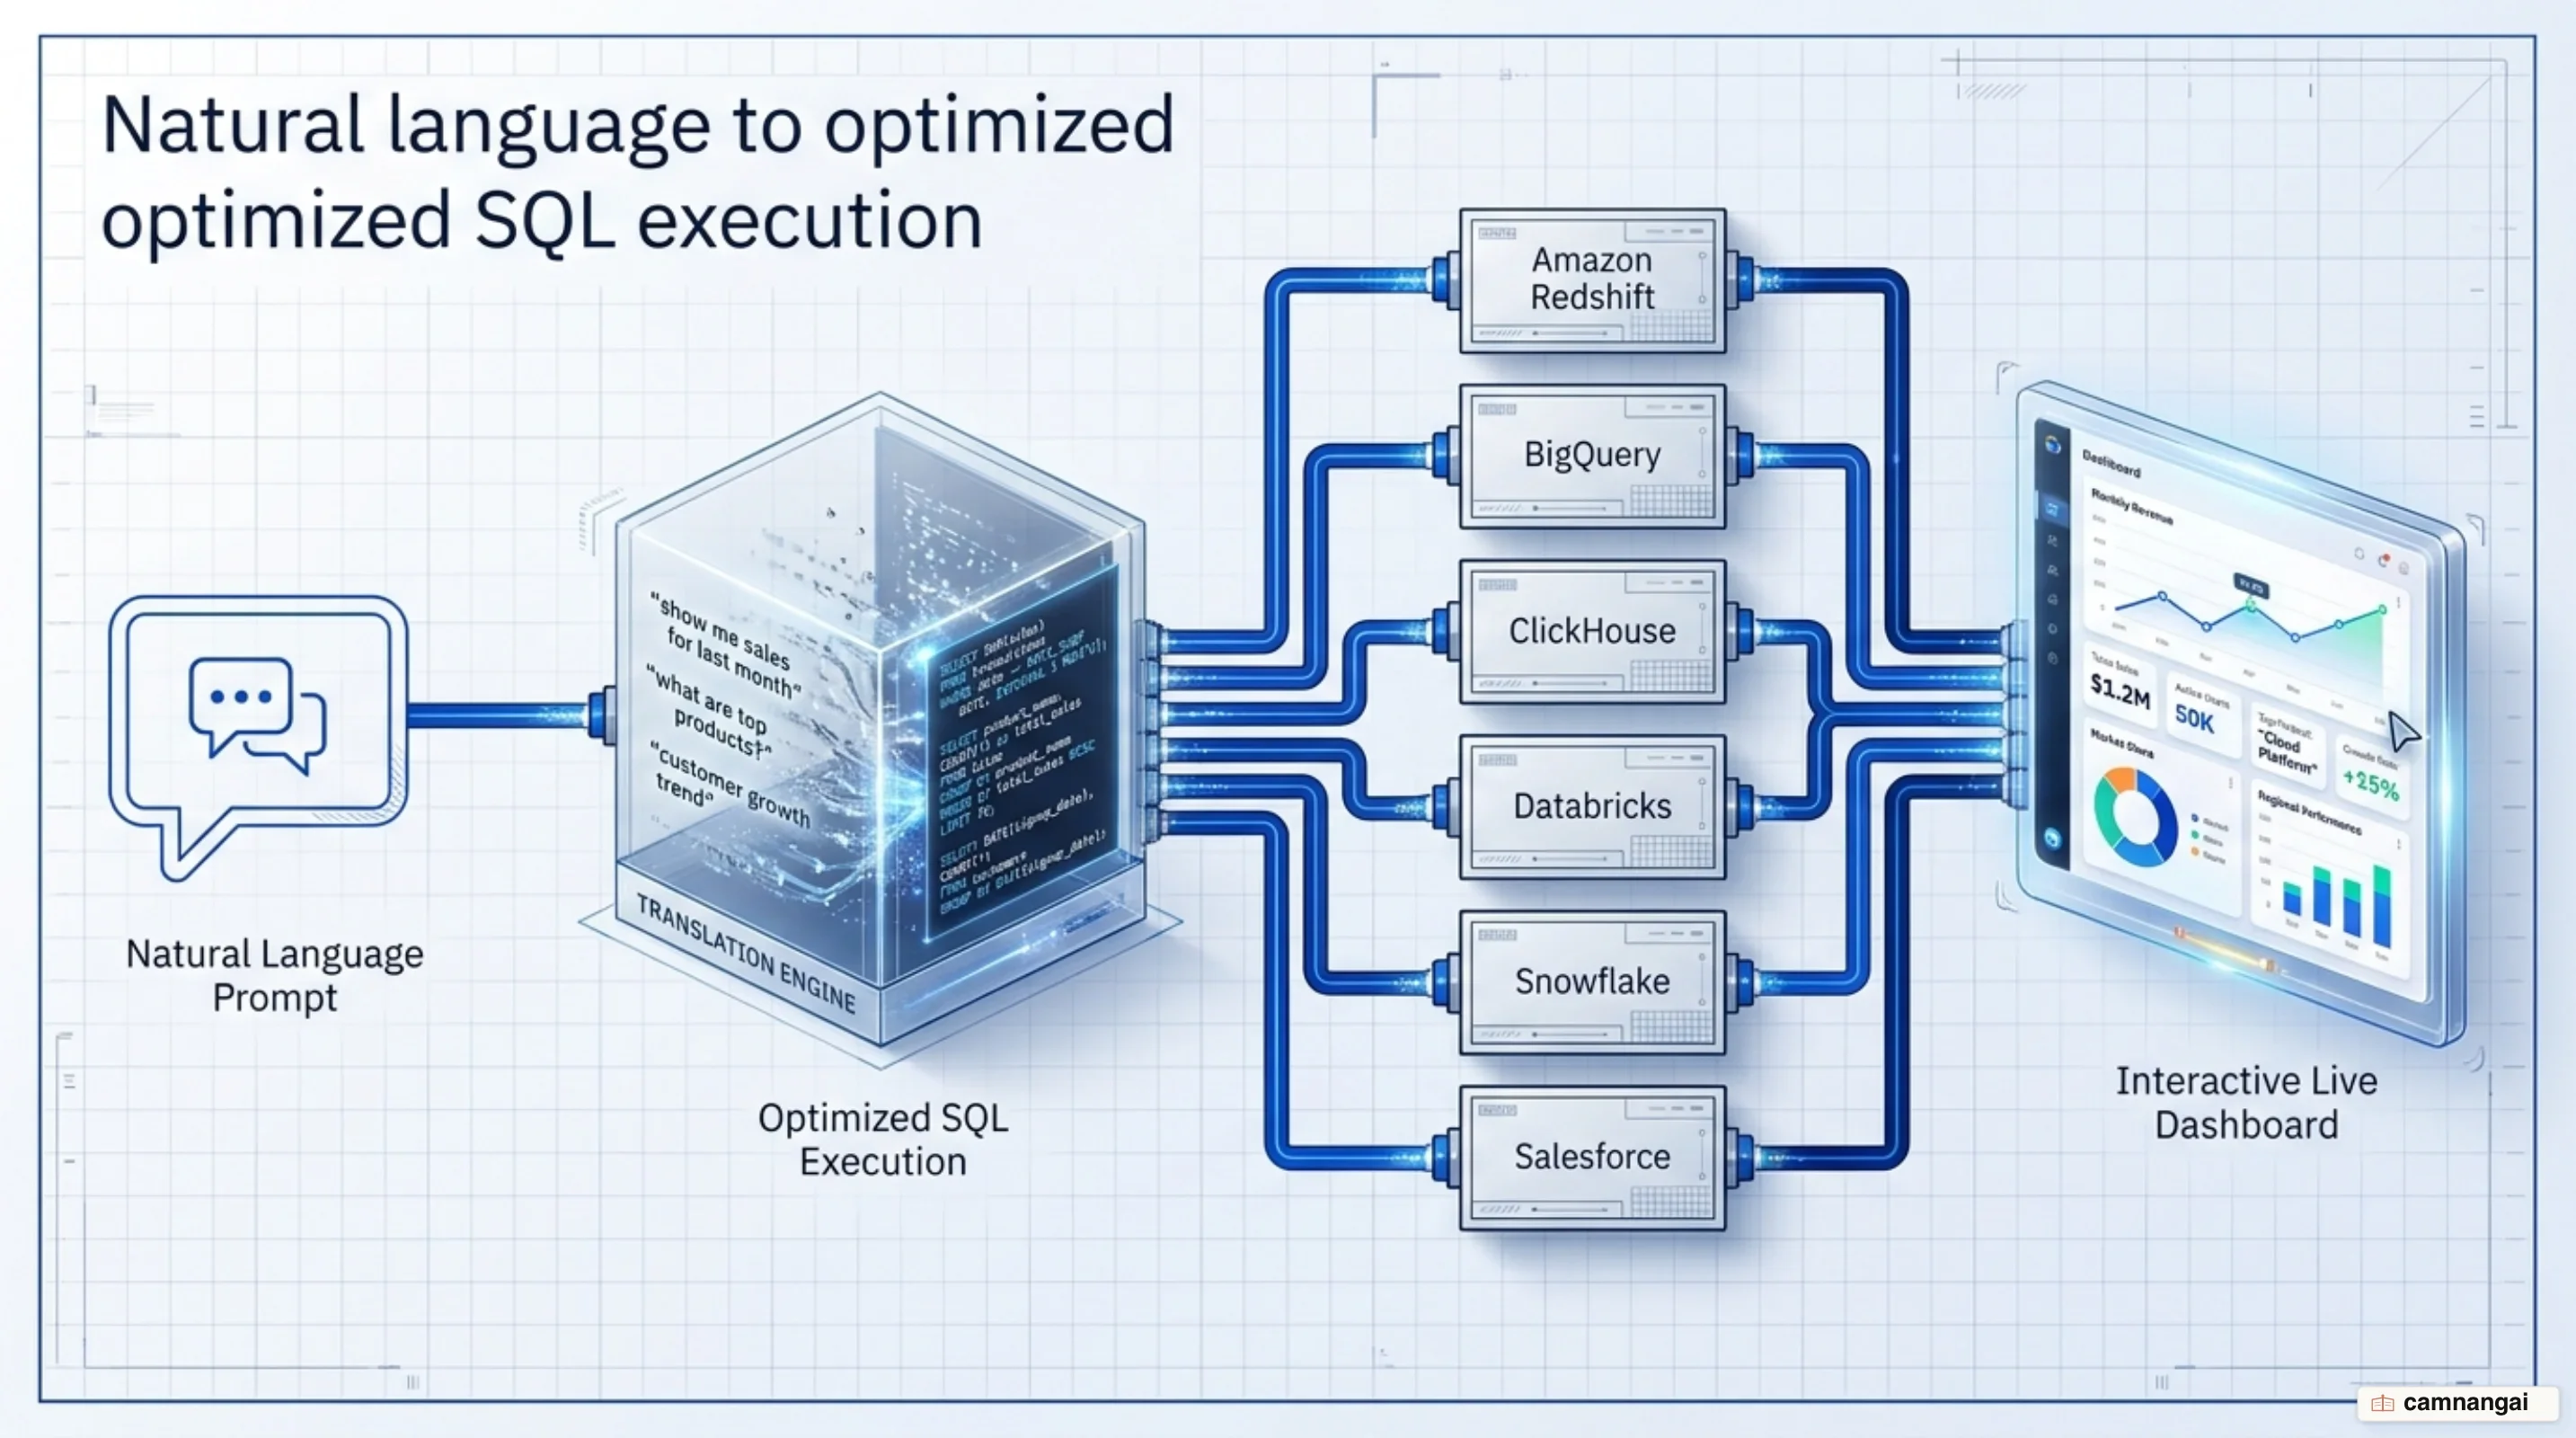
The primary focus of Claude Dashboards is rapid, ad-hoc data exploration rather than replacing long-term semantic BI layers. You can ask exploratory questions—such as comparing weekly user signups by channel over consecutive months or listing open Salesforce opportunities filtered by deal stage and account owner. Query execution maintains identity pass-through across shared assets: when a colleague views a shared dashboard, the underlying SQL queries re-execute against that specific viewer's individual warehouse credentials and access roles. This prevents data leakage across organizational boundaries by ensuring users only see rows and columns they are explicitly authorized to read.
Because the tool generates standard SQL under the hood, you can inspect or refine the query structure directly if the returned data does not match your precise intent. Clicking on any chart component opens the generated SQL block, allowing engineers and analysts to verify join conditions, filter clauses, and aggregation metrics before circulating the dashboard across the organization.
-- Prompt: "Build a dashboard of this quarter's revenue by region"

SELECT
    region,
    SUM(revenue) AS total_revenue,
    DATE_TRUNC('quarter', transaction_date) AS quarter
FROM sales_records
WHERE transaction_date >= '2026-07-01'
GROUP BY region, quarter
ORDER BY total_revenue DESC;
Claude Motion: Code-Based Explainer Animations vs. Generative Video
Unlike traditional video diffusion models that generate synthetic video frames or artificial human footage, Claude Motion operates on a code-driven execution pipeline. When you prompt Claude Motion to visualize a complex topic, it writes executable code that programmatically animates text elements, data charts, geometric shapes, and user-uploaded asset images. This approach eliminates spatial distortion, word warping, or visual hallucination artifacts inherent to generative video models, ensuring that numerical figures and textual labels remain exact.
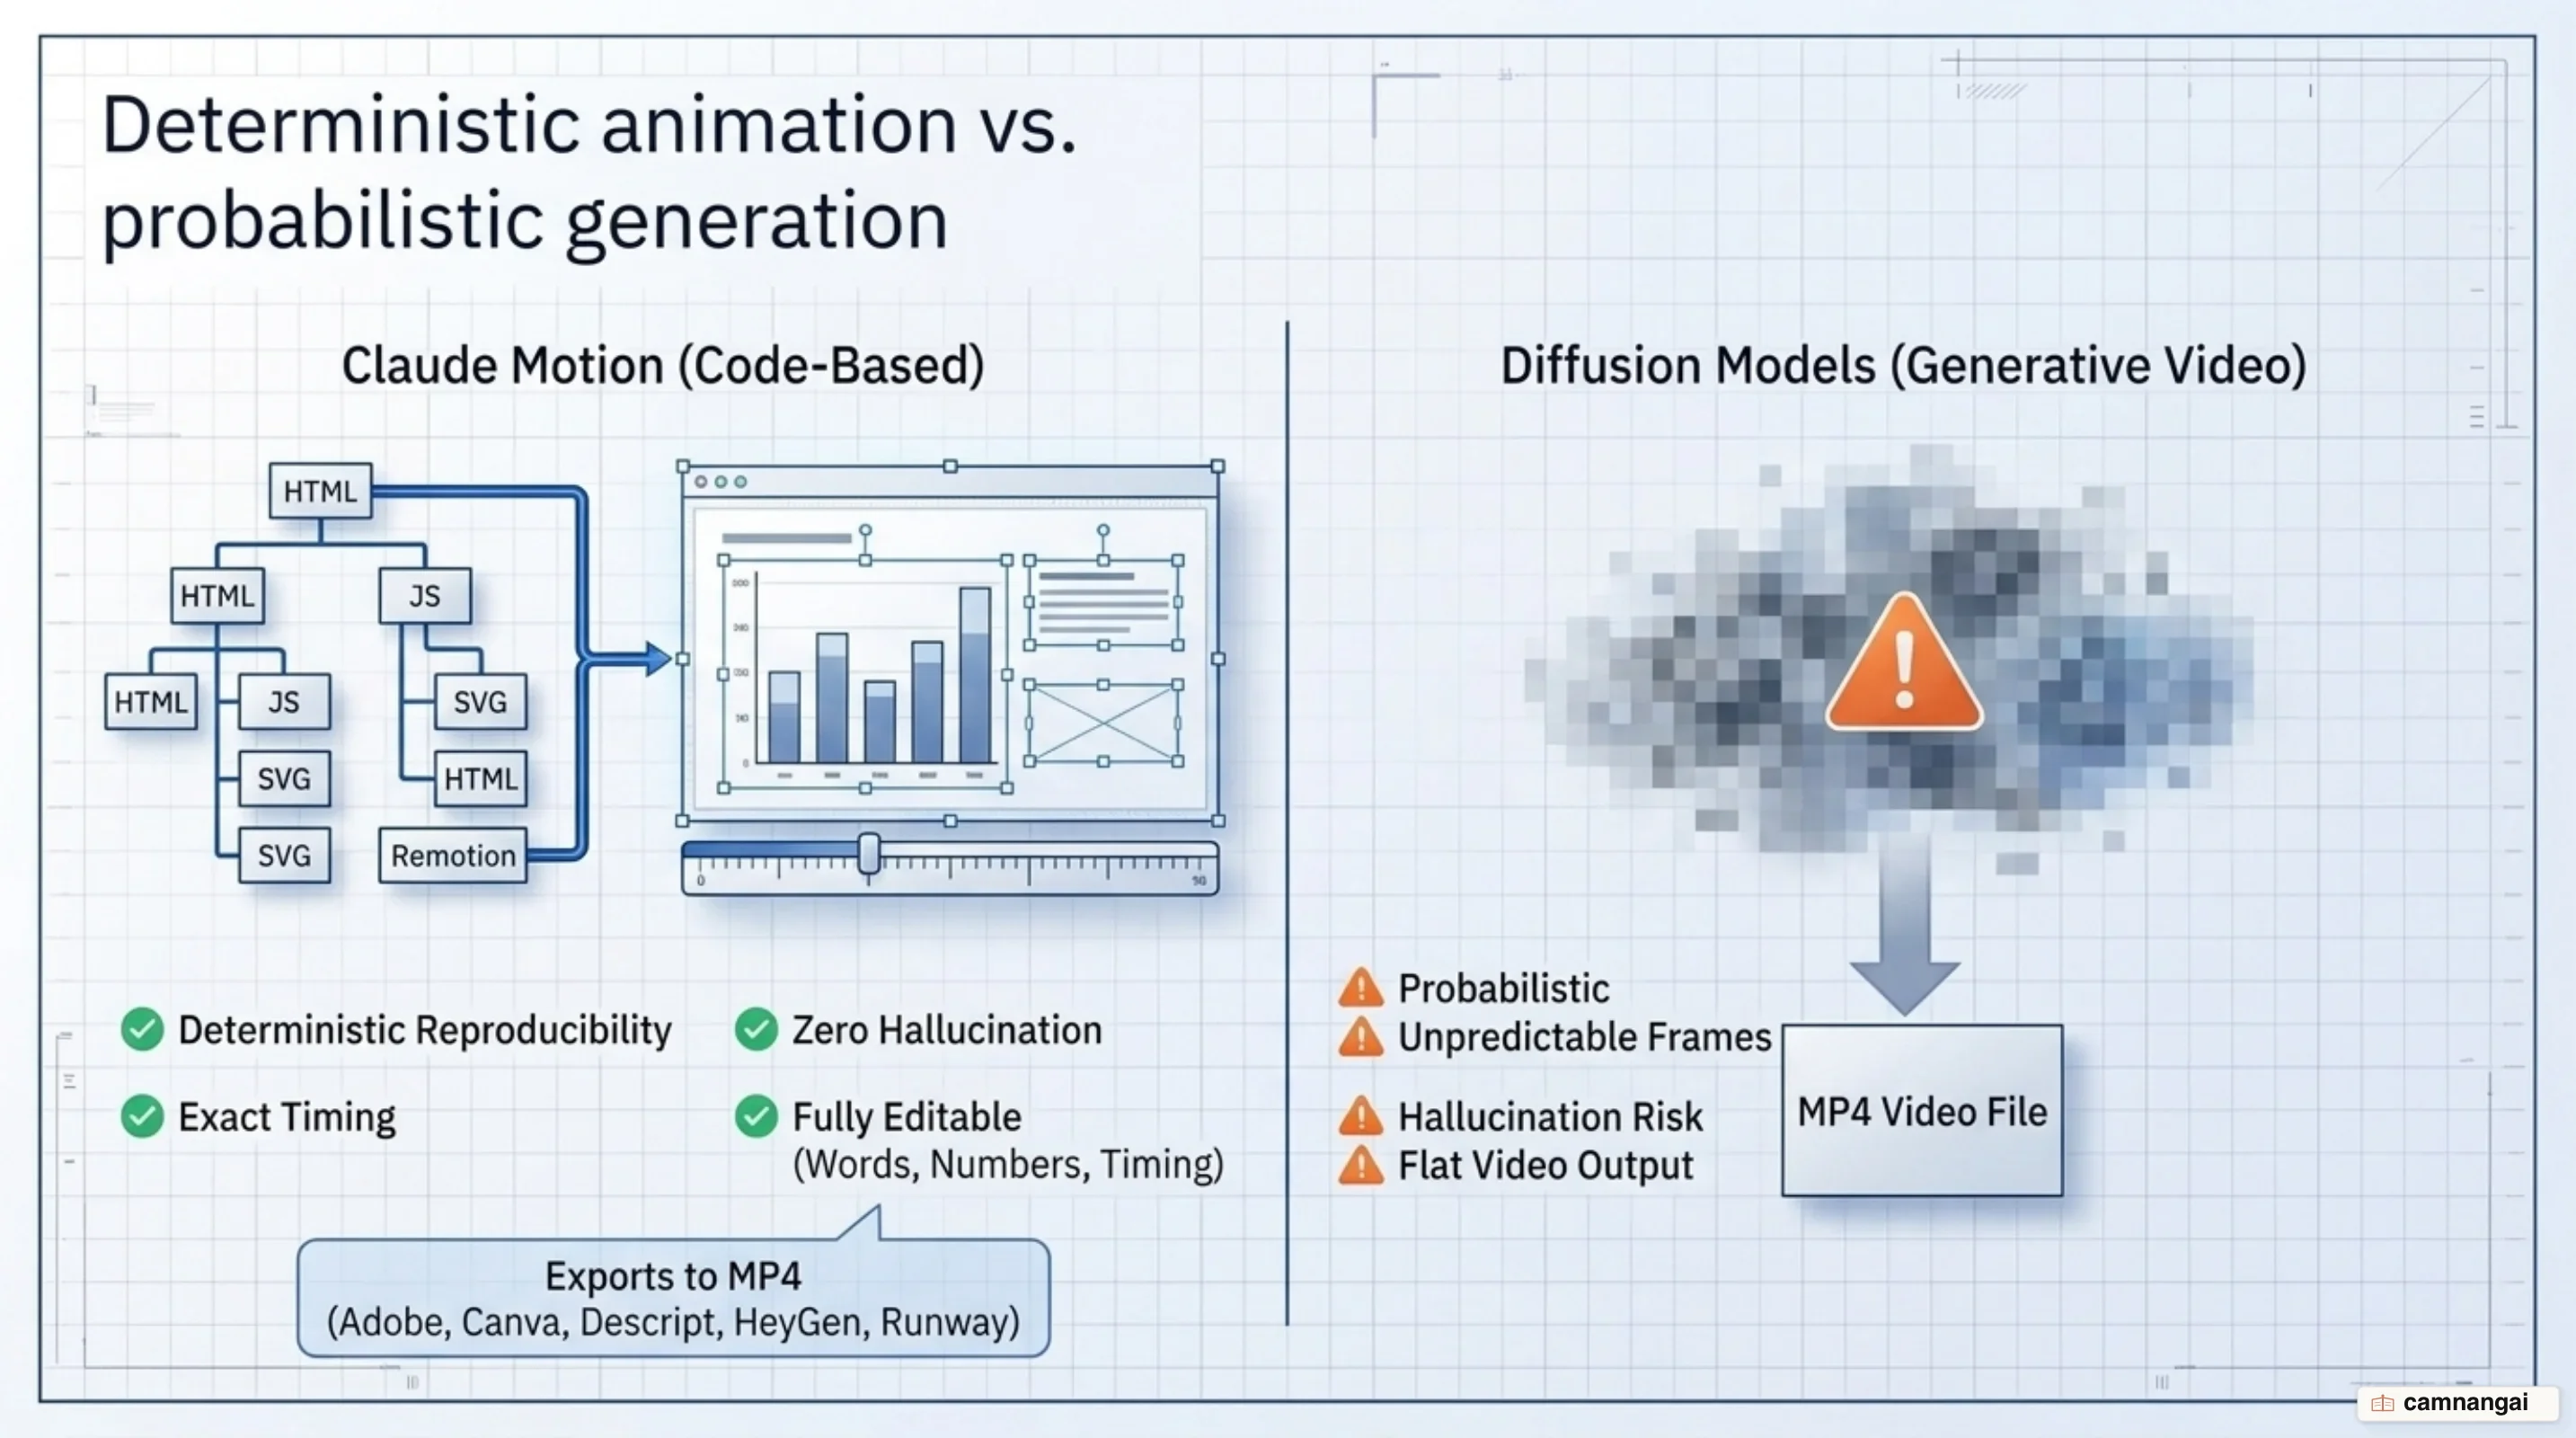
Because each output is represented entirely as underlying render code, you retain full programmatic and textual control over the artifact. You can adjust specific scene timing, modify numerical values, or reword titles directly within the editor interface or by issuing follow-up chat prompts without requiring a complete re-render from scratch. Once finalized, you can export the animation directly to an MP4 video file or hand off the asset to external post-production platforms including Adobe, Descript, HeyGen, Higgsfield, invideo, Luma AI, and Runway, with integrations for Canva and Captions planned for future releases.
Under the hood, Motion generates programmatic scene structures—similar to declarative React/Remotion or Canvas animation components—allowing fine-grained manipulation of timing curves, object positions, and asset states across the video timeline.
// Programmatic scene layout and motion timing generated by Claude Motion
import { Composition, Sequence, useCurrentFrame, interpolate } from "remotion";

export const RevenueExplainer = () => {
  const frame = useCurrentFrame();
  const opacity = interpolate(frame, [0, 30], [0, 1], { extrapolateRight: "clamp" });
  const scale = interpolate(frame, [15, 45], [0.8, 1], { extrapolateRight: "clamp" });

  return (
    <Sequence from={0} durationInFrames={90}>
      <div style={{ opacity, transform: `scale(${scale})`, flex: 1, padding: 40 }}>
        <Header title="Q3 Revenue Growth" subtitle="+18% YoY Regional Lift" />
        <AnimatedBarChart source="sales_records" frame={frame} />
      </div>
    </Sequence>
  );
};
Query Transparency and Exporting to the BI Ecosystem
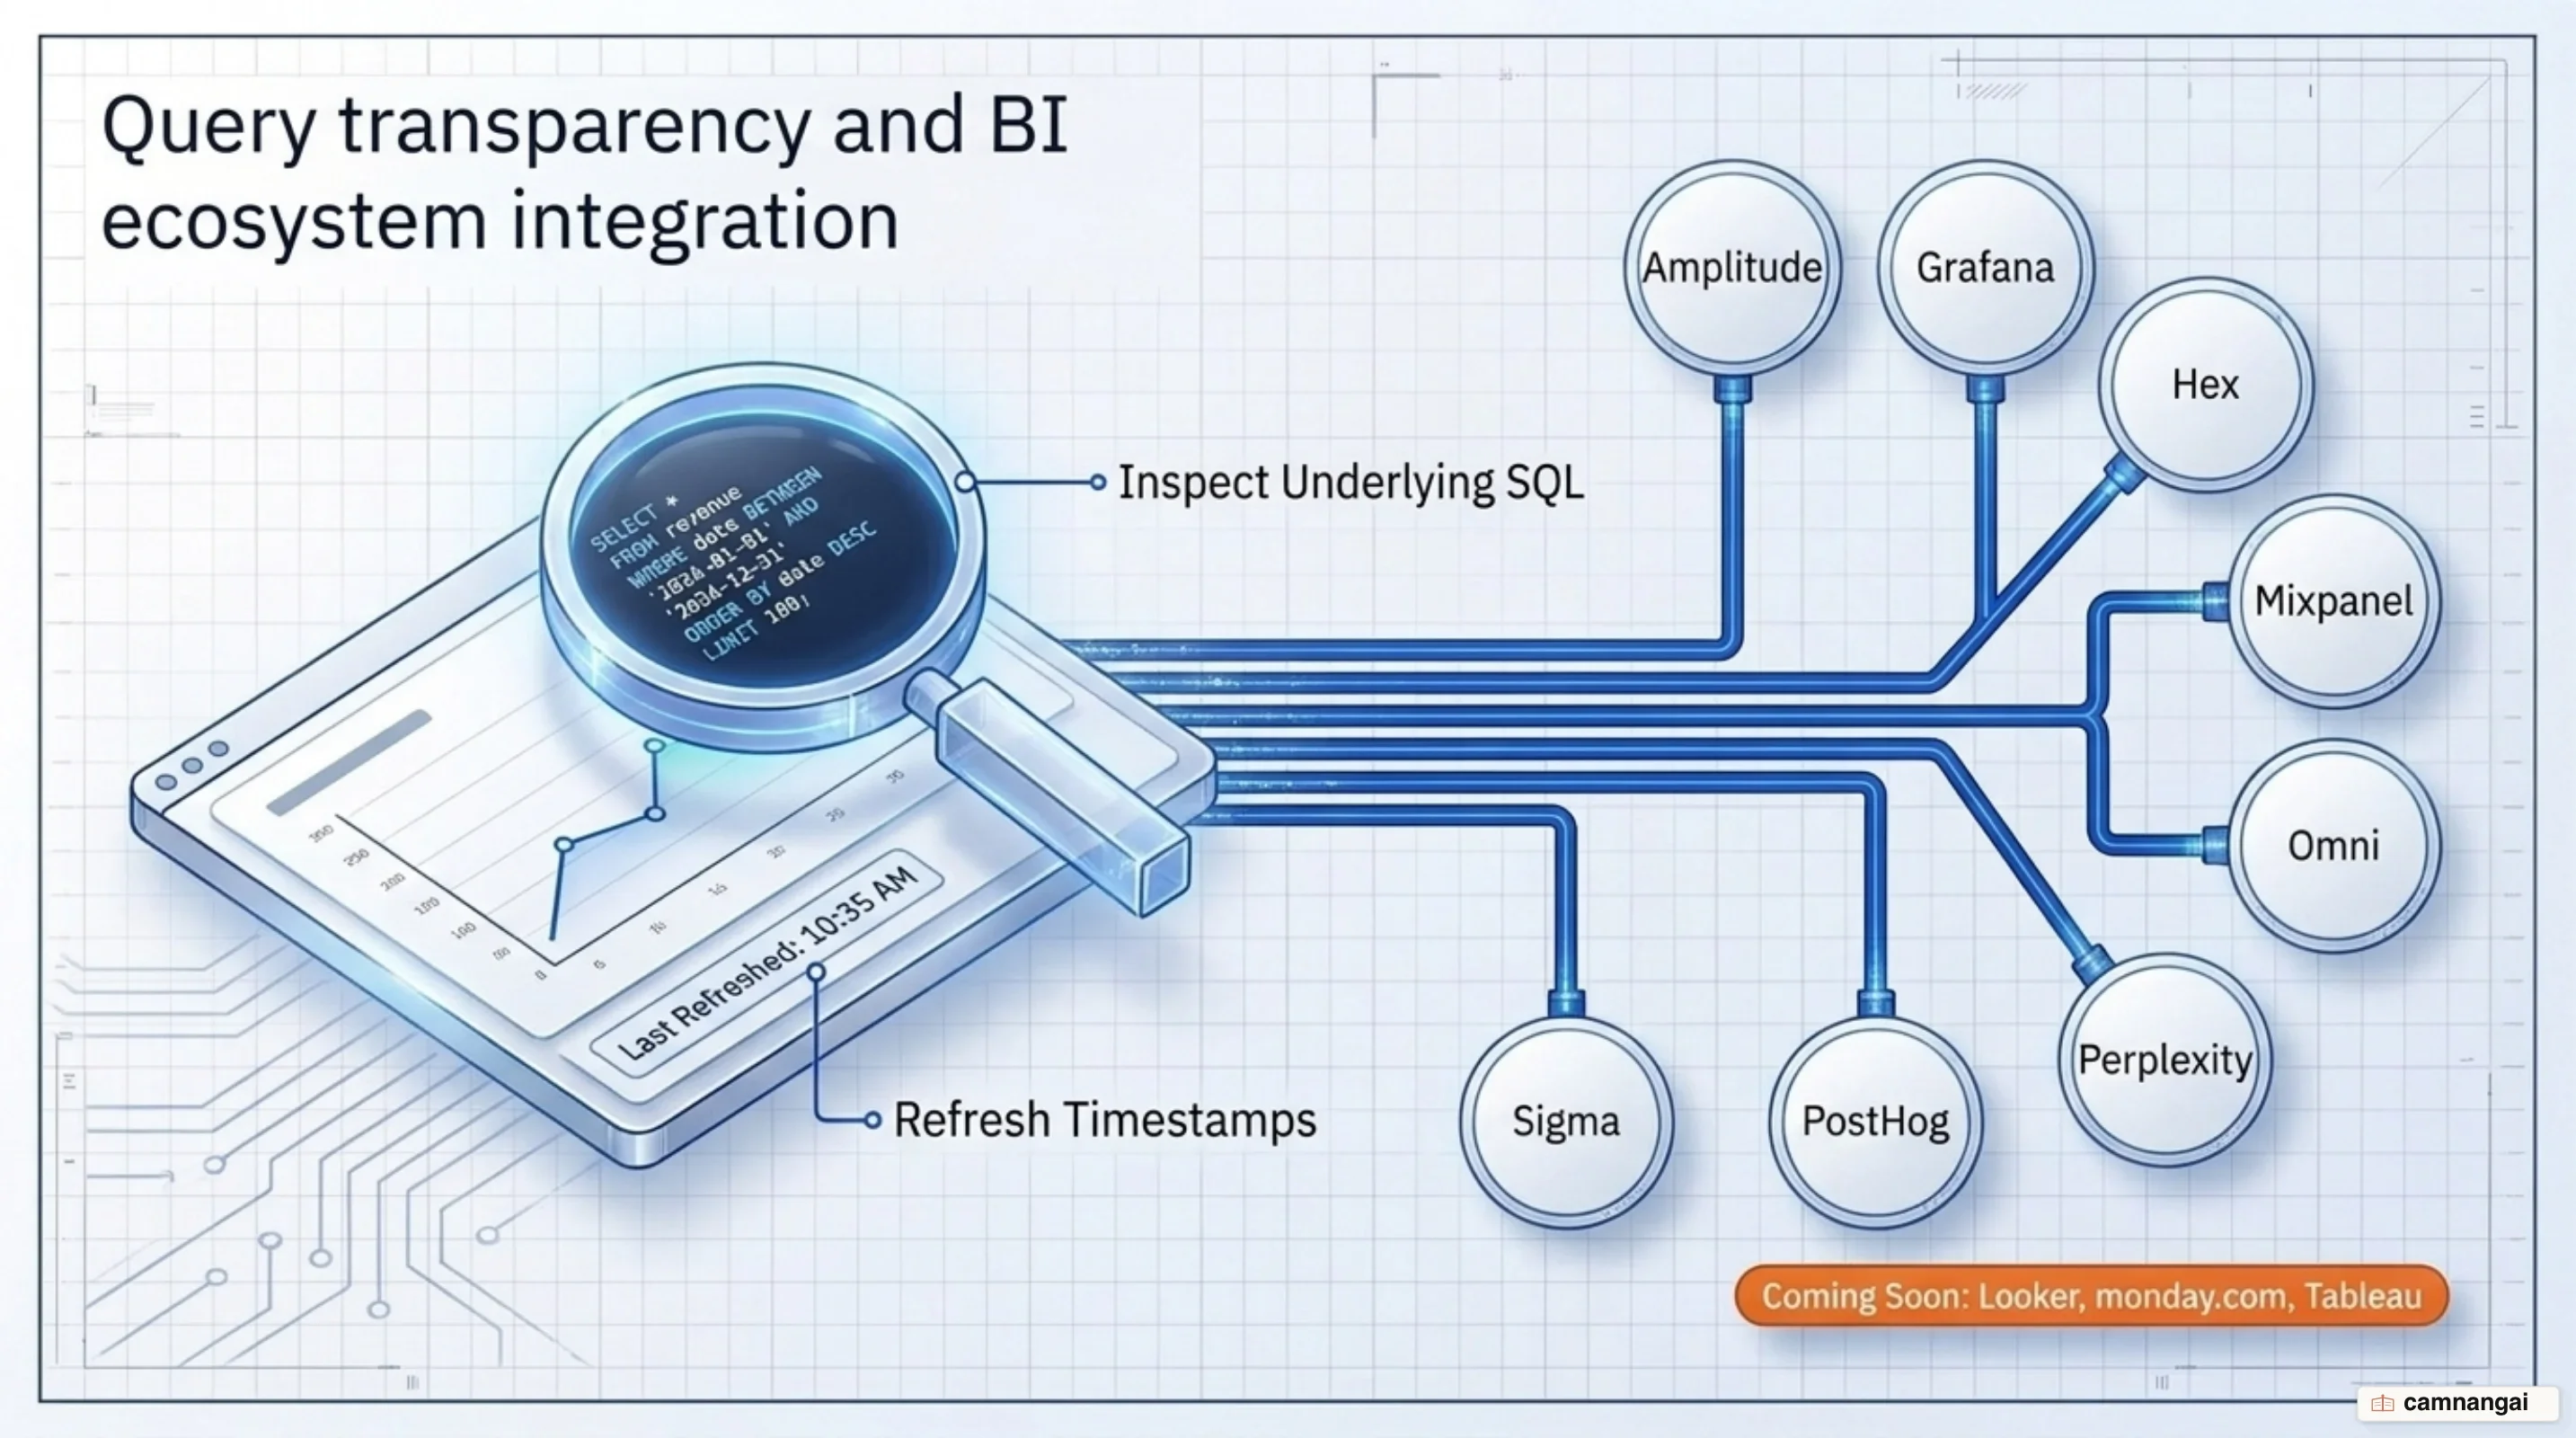
Claude Dashboards eliminates opaque metrics by providing direct query visibility across all generated charts. Clicking on any number or chart component opens the exact SQL query executed against your data platform, alongside an explicit timestamp marking the last refresh. If an output appears incorrect or misinterprets business definitions, you can review the generated SQL or ask Claude directly to explain its logic and adjust the query construct.
Query execution strictly adheres to the identity and data permission boundaries established in your connected warehouse or CRM platform. Dashboards run using the individual user's existing credentials, ensuring that a user only sees data, rows, and columns they are explicitly authorized to access within the underlying source system. Shared dashboards function similarly: when a colleague views a shared artifact, the queries run against their own connection permissions by default, preventing unauthorized data exposure across organizational boundaries.
Claude Dashboards is explicitly structured as an ad-hoc exploratory tool rather than a full replacement for established business intelligence infrastructure. When a query requires advanced modeling, semantic layers, or production-grade dashboarding, you can export or hand off the artifact directly to downstream analytics platforms including Amplitude, Grafana, Hex, Mixpanel, Omni, Perplexity, PostHog, and Sigma. Additional connectors for Looker, monday.com, and Tableau are currently in development.
Plan Availability, Usage Limits, and Enterprise Governance
Feature distribution across subscription tiers follows specific administrative defaults. Claude Dashboards is available in beta on Pro, Max, Team, and Enterprise plans, defaulting to off for Enterprise accounts. Claude Motion is available in beta exclusively on Team plans (on by default) and Enterprise plans (off by default). Meanwhile, Claude Docs, Slides, and Design have achieved General Availability across all tiers, including Free plans; these GA templates will automatically turn on for Enterprise organizations on October 15, 2026, unless manually disabled earlier. The standalone web application at claude.ai/design will shut down on December 14, 2026. To migrate team design systems, administrators must click the "Migrate team design systems" button on the Artifacts page; up to 60 projects will automatically populate in the Artifacts tab, but inline project chats and comments will not migrate and will be permanently lost after December 14, 2026.
To enable Artifacts templates, administrators must first activate "Cloud code execution and file creation" under Organization Settings > Capabilities. Enterprise plan administrators can leverage custom role capabilities to restrict template access—such as Dashboards or Motion—to specific user groups. Sharing controls are managed via separate toggles for External Sharing (public link generation) and Email Invitations outside the organization. From a compliance perspective, Artifacts supports Customer-Managed Encryption Keys (CMEK) and logs artifact creation events via the Compliance API, though granular internal document edits and inline comments are not captured. While HIPAA-ready configurations allow admins to enable these templates after accepting terms, Artifacts operate outside the standard Business Associate Agreement (BAA) and must not contain Protected Health Information (PHI). Note also that Claude Design does not currently support data residency requirements.
Consumption for Dashboards, Motion, and other Artifacts draws directly from existing account token allowances without requiring a separate provisioned budget. For seat-based Team and Enterprise tiers, activity consumes standard session and weekly seat usage limits, with options for admins to purchase additional usage credits. For usage-based Enterprise plans, generation is billed against account consumption at standard API rates. Generating complex or lengthy programmatic animations in Claude Motion consumes a proportionally larger portion of a user's operational usage limit compared to standard text interactions.
When to Introduce Dashboards and Motion to Your Team
Introduce Claude Dashboards to your engineering and operations teams when the primary objective is rapid, exploratory data querying and ad-hoc metric visual prototyping. It is effective for reducing routine data request queues assigned to centralized analytics teams by allowing non-technical stakeholders to inspect warehouse data safely. However, you should avoid deploying Dashboards as a comprehensive replacement for production Business Intelligence pipelines that require strict semantic modeling, complex data transformations, or governance models managed by data engineering teams.
Deploy Claude Motion when you need to construct clear technical walkthroughs, internal all-hands explainer visuals, or board presentation chart animations where numbers, text labels, and execution timing must remain precise and fully editable. Motion is ideal when team members need to update dynamic presentation assets directly without re-rendering video feeds. Conversely, avoid using Motion if your project explicitly requires photorealistic video footage, real-world camera recording, or synthetic human presentations, as the underlying architecture strictly outputs programmatic code animations.
To roll out these tools systematically, begin by navigating to Organization Settings > Capabilities and confirming that "Cloud code execution and file creation" is toggled on before enabling Dashboards or Motion templates under Artifacts. Next, ensure individual team members configure their data credentials for connected platforms like Snowflake or Databricks to enforce identity-based access control. Finally, review organizational security requirements to establish clear policy guardrails around external link sharing and outside email invitations prior to broader team usage.
References
- Build live dashboards and animate explainers with Claude — Anthropic
- Get started with Claude Dashboards — Claude Help Center
- Get started with Claude Motion — Claude Help Center
- Artifacts admin guide for Team and Enterprise plans — Claude Help Center
- Claude can now build your dashboards — The New Stack
- Claude can now build live dashboards and animated explainers from your data — Digital Trends
- Anthropic Launches Claude Dashboards and Motion in Beta — MLQ News
- Claude can now turn your data into a live, interactive dashboard — XDA Developers