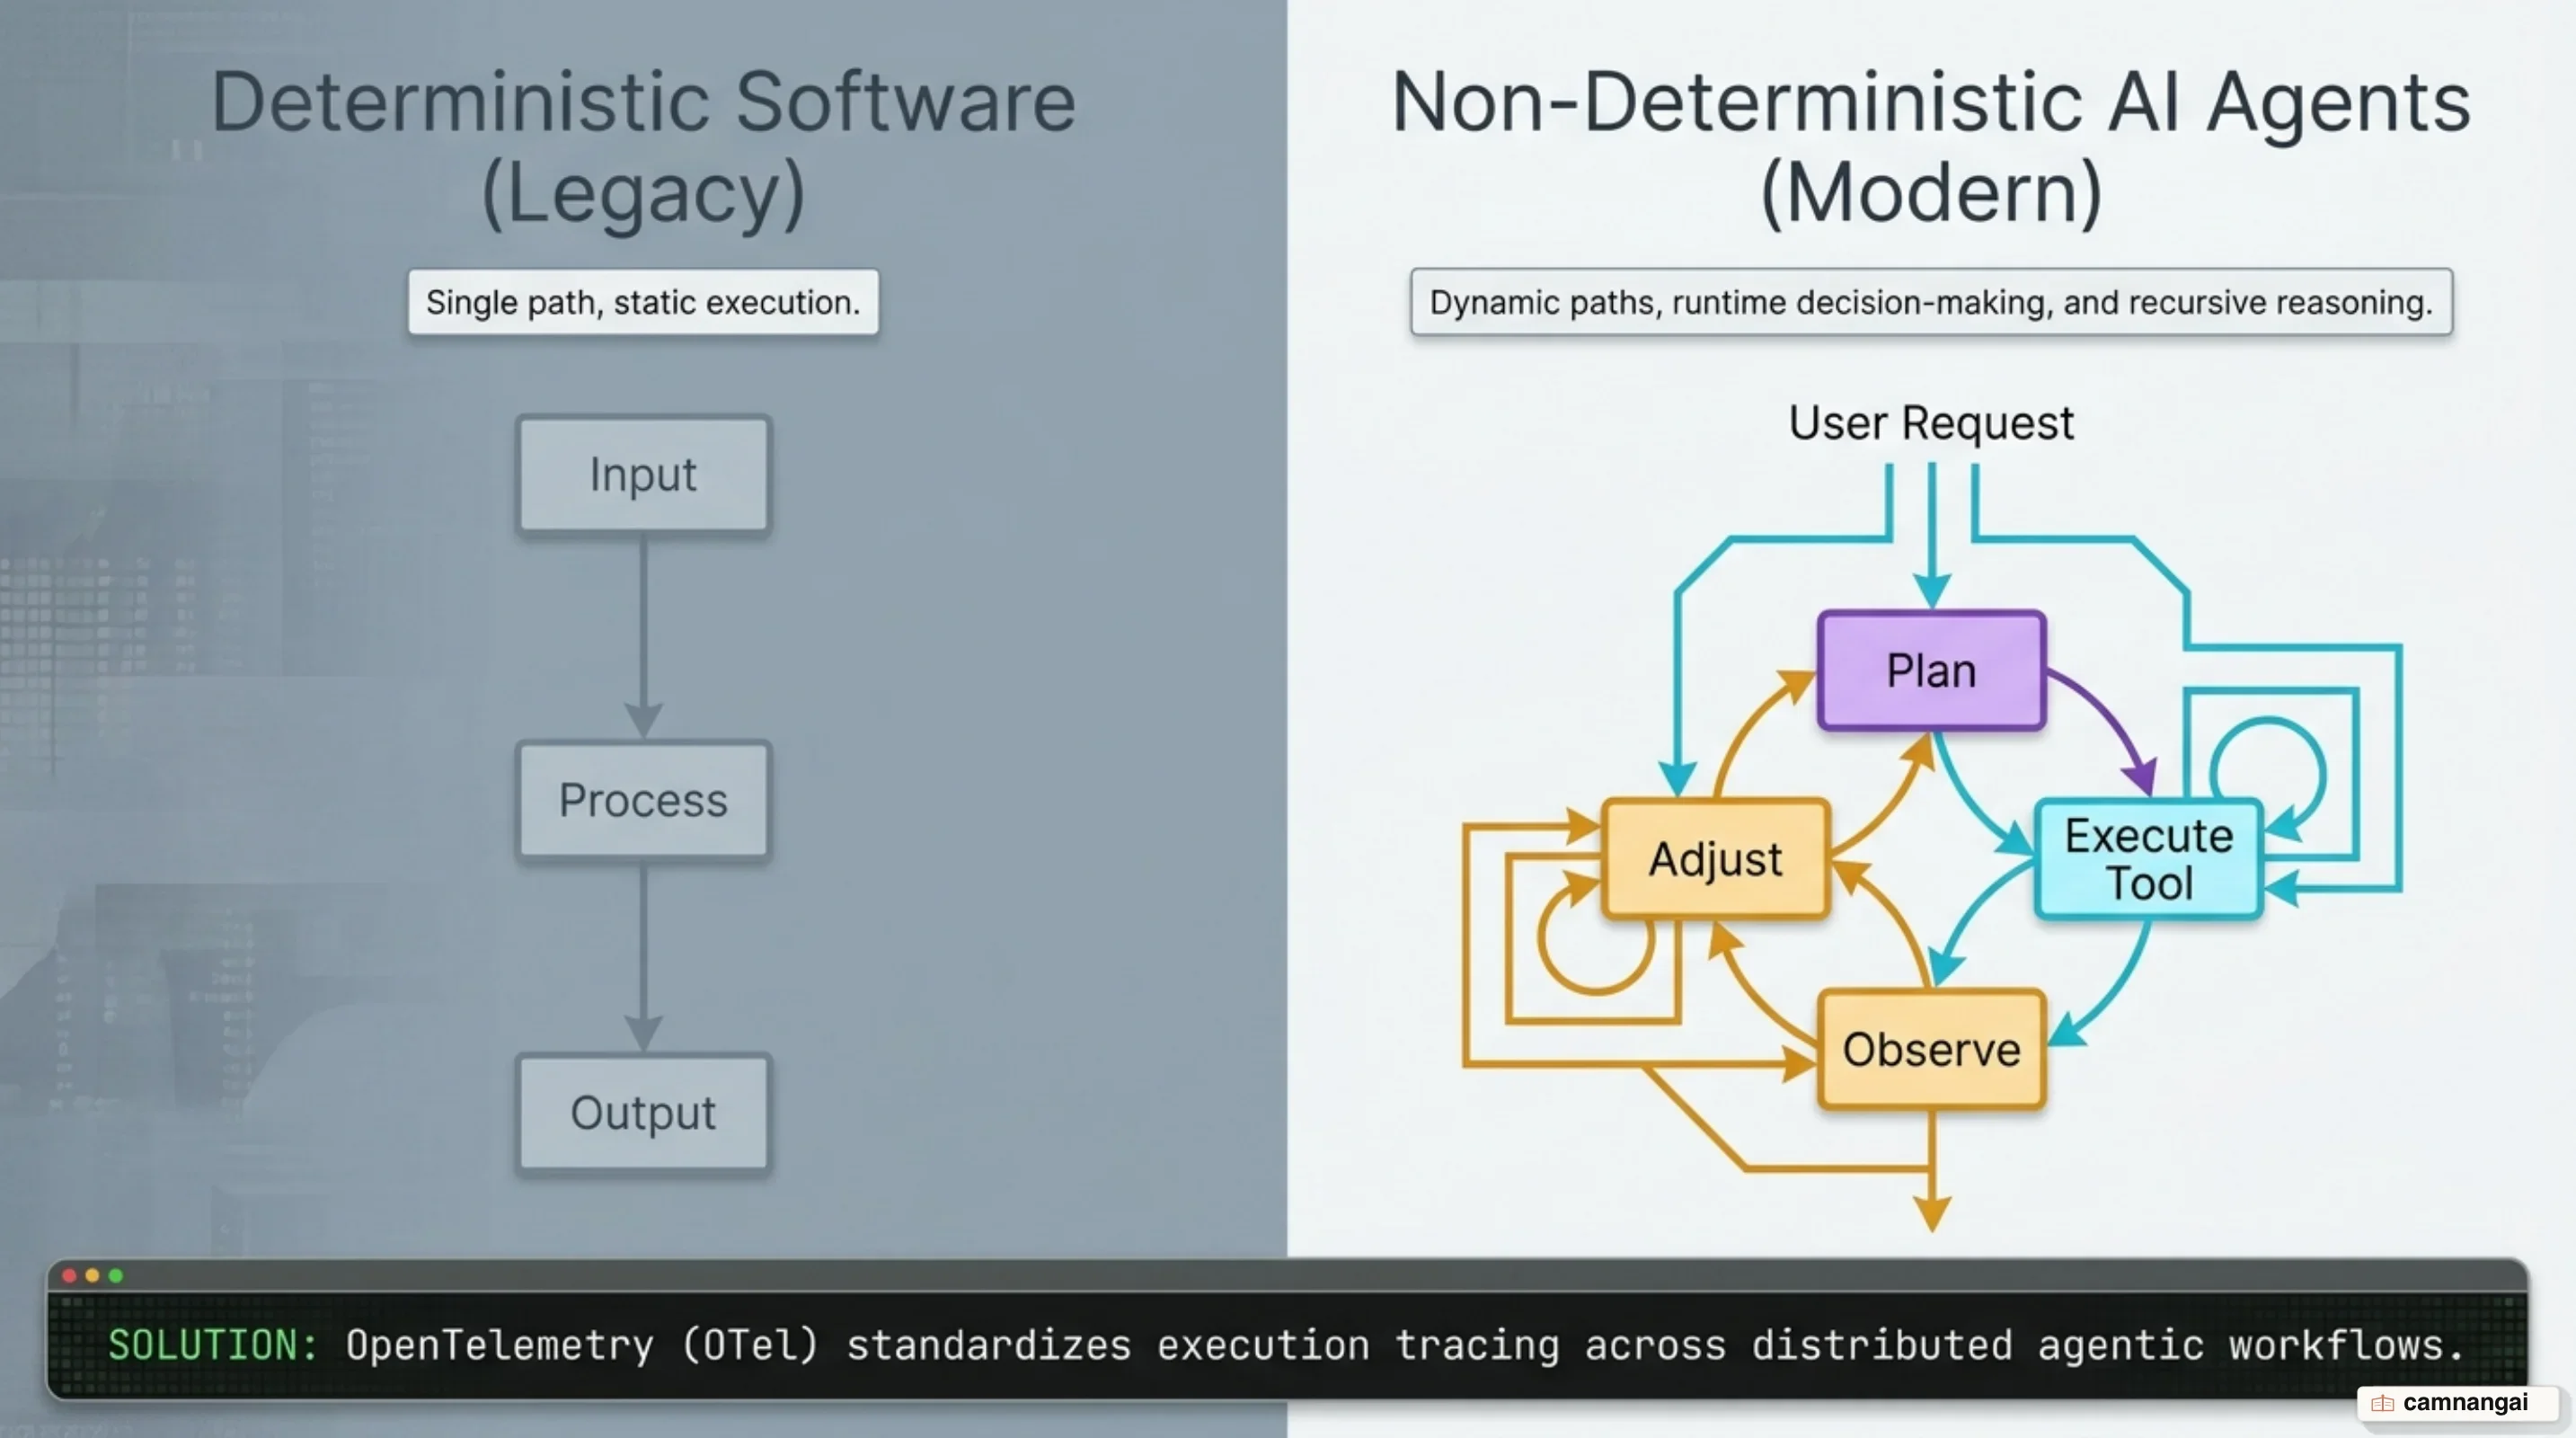
To debug AI agents at scale, traditional APM tools quickly fail. Traditional monitoring falls short because operate as non-deterministic, multi-step loops where HTTP 200 responses frequently mask logical and tool failures.
OpenTelemetry distributed tracing, combined with standardized GenAI semantic conventions, provides the only scalable way to debug AI agents at scale.
By capturing complete parent-child span hierarchies, window drift, and tool execution parameters, OpenTelemetry gives you full operational visibility across non-deterministic agent reasoning trees.
Without distributed tracing, troubleshooting why an agent drifted or incurred runaway costs becomes impossible.
Why Traditional APM Fails for AI Agents
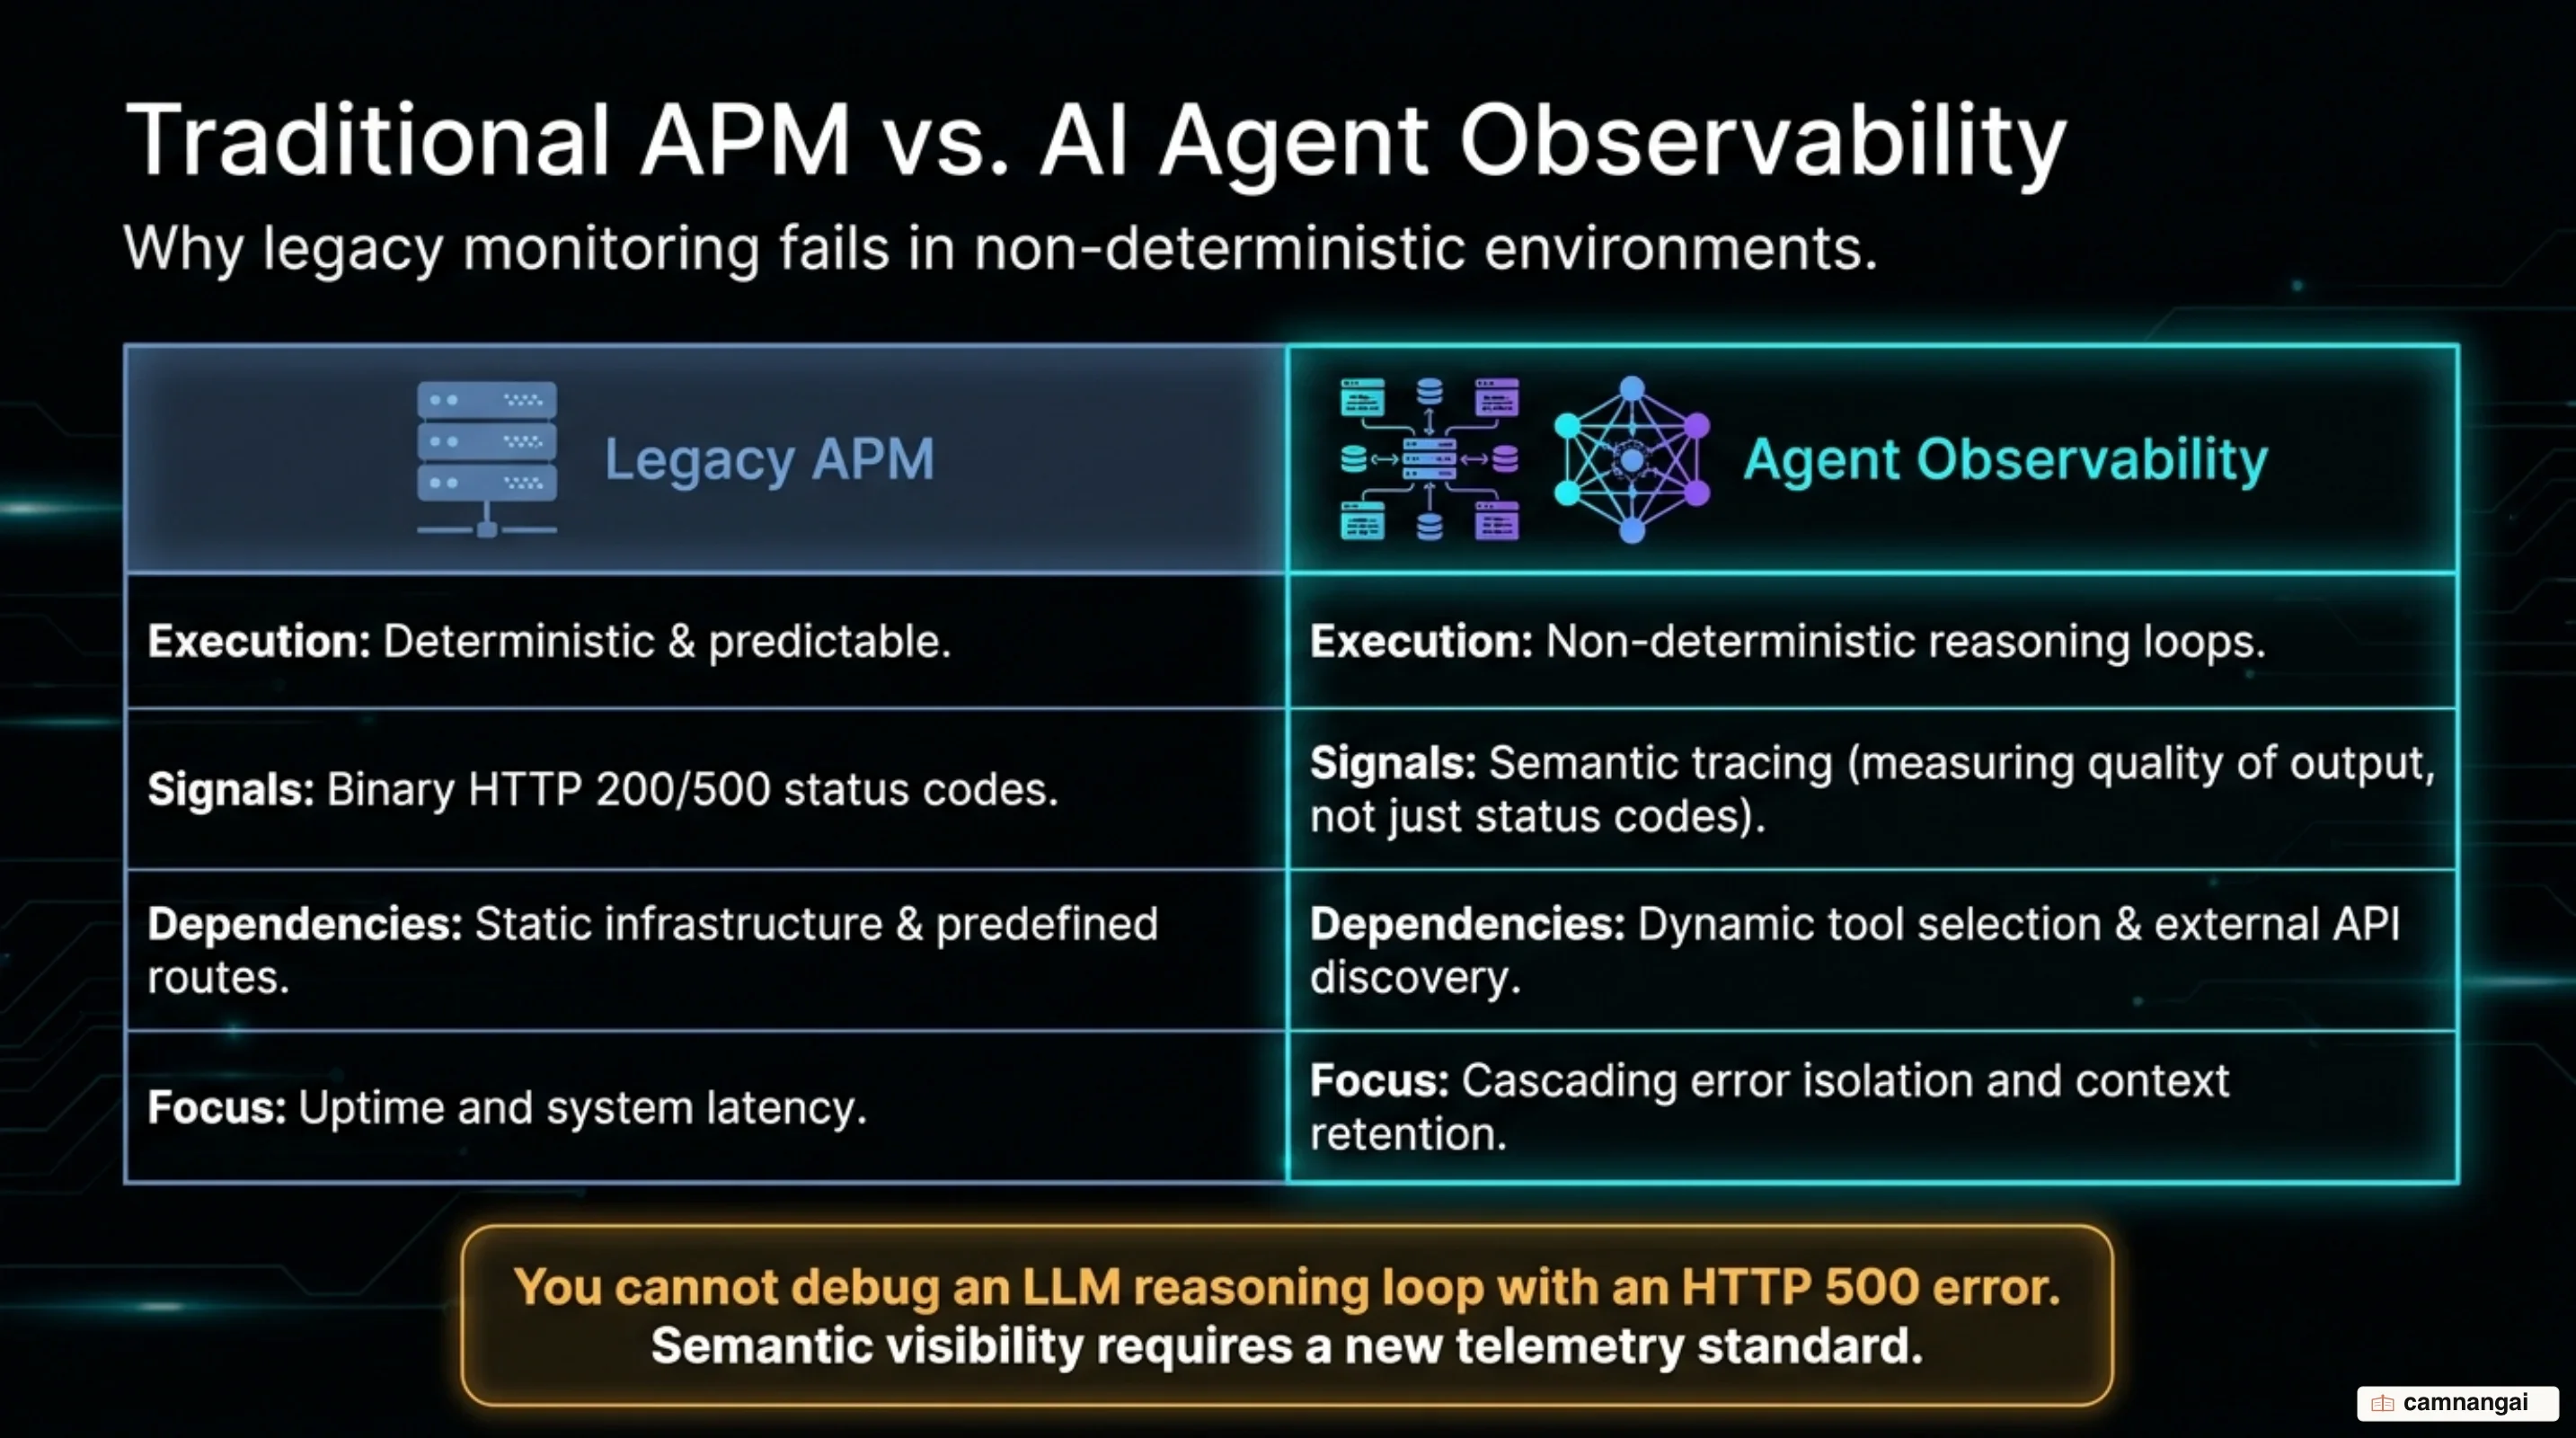
Traditional Application Performance Monitoring (APM) was designed around deterministic microservice architectures. Standard APM relies on predictable request-response paths, server latency metrics, and HTTP status codes to determine application health.
In contrast, modern agentic systems are built on non-deterministic (LLM) execution loops and multi-turn tool interactions. In these systems, a service does not follow a fixed execution branch; instead, an agent continuously evaluates model outputs to decide its next step, invoking external tools, querying vector storage, or executing iterative model calls until a goal condition is satisfied.
Because of this non-deterministic loop structure, standard HTTP status codes yield false health signals. An agent service will routinely return an HTTP 200 OK status while experiencing complete operational failure. The underlying model might hallucinate invalid tool invocations, generate malformed JSON arguments that fail backend schema validation, or fall into unrecoverable logic loops. Traditional APM sees a successful HTTP 200 response with acceptable transport-level latency, missing the reality that the agent failed to complete its assigned task or delivered hallucinated data to the client.
Beyond that, traditional APM platforms suffer from severe high-cardinality and telemetry gaps when applied to agentic workflows. Standard APM is unequipped to track how prompt context accumulates across multi-turn chat sessions—such as observing context window expansion jumping from 18.5k tokens to 73.8k tokens (+55.3k tokens) within a single session. Legacy tools cannot track token window growth, prompt and completion variations, , or asymmetric reasoning paths across multiple execution turns. Without specialized distributed tracing, troubleshooting why an agent drifted, degraded in output quality, or incurred runaway API costs becomes impossible.
Reference Architecture: What Needs to Be Observed in an Agentic System
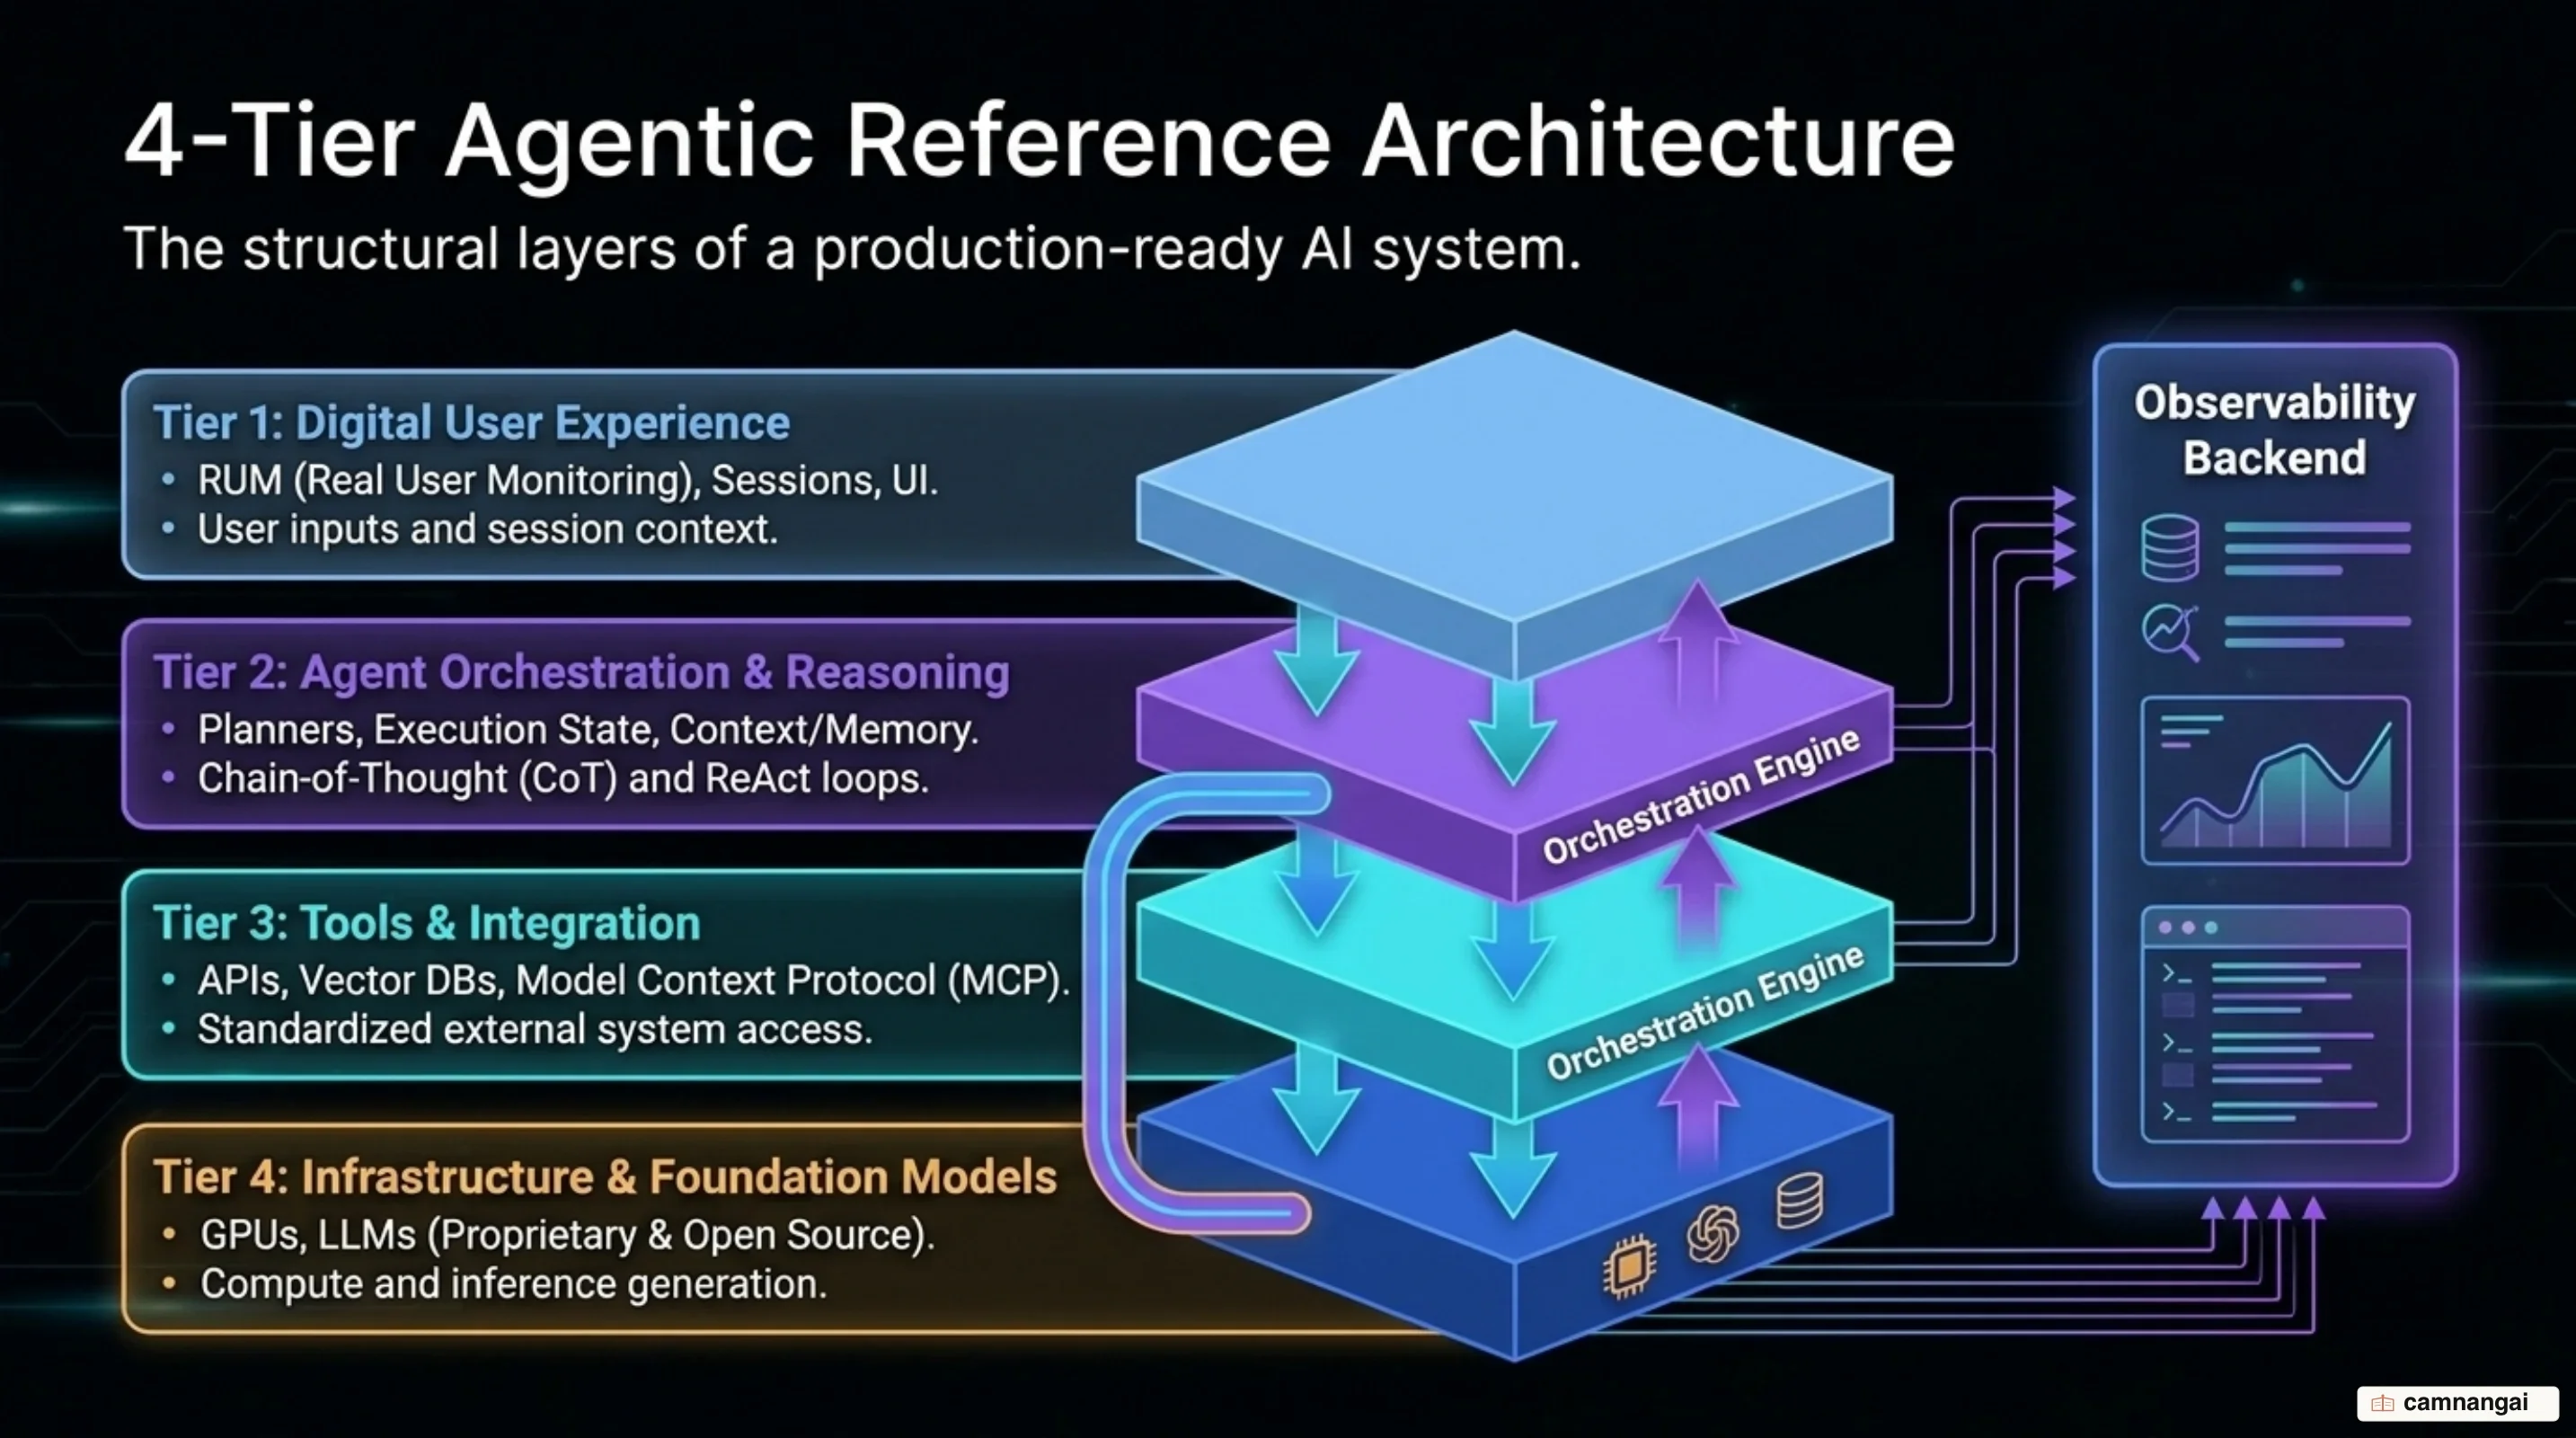
Observing an enterprise agentic system requires a multi-layered observability data plane that spans the entire execution stack. At the foundation layer sit the LLM foundational providers (such as OpenAI, Anthropic, Gemini, AWS Bedrock, and Vertex AI). Operating directly above these endpoints are agent orchestration frameworks (including CrewAI, LangChain, AutoGen, LlamaIndex, PydanticAI, Agno, and BeeAI) that coordinate reasoning loops, state management, and task delegation. The architecture also integrates Model Context Protocol (MCP) servers, vector databases for retrieval-augmented generation (), and custom backend tools or microservices.
(MCP) servers serve a critical dual role in enterprise architectures. First, MCP acts as a standardized tool interface allowing agents to interact with external tools and resources. Second, MCP enables developer AI coding agents (such as Claude Code or Cursor) to directly query production observability backends. By exposing telemetry endpoints over MCP, your developer coding agents can query live production traces from within the IDE, pairing slow execution traces with backend source code to automatically diagnose N+1 database queries, slow tool invocations, and execution bottlenecks.
To gain end-to-end operational visibility across this multi-layered stack, your telemetry system must capture three core OpenTelemetry observability signals tailored specifically for GenAI: Traces, Metrics, and Events. Traces capture the full, multi-step execution trees across all framework components and model calls. Metrics provide aggregate quantitative tracking for token counts, step latencies, error rates, and model usage costs. Events log distinct occurrences within the execution context, such as structured model inputs, completions, or specific operational exceptions.
At each layer of the architecture, the telemetry data plane must collect explicit contextual parameters. This includes capturing parent-child execution graphs, tool decision parameters, retrieval context documents, spans, model configuration parameters (such as model name or ), and explicit user/session identifiers. Unifying these signals into a single data plane ensures that when an agent execution fails, you can isolate whether the root cause lies in foundation model response drift, orchestrator framework routing logic, vector database retrieval latency, or external tool failure.
OpenTelemetry for AI Agents: The Hierarchical Span Tree
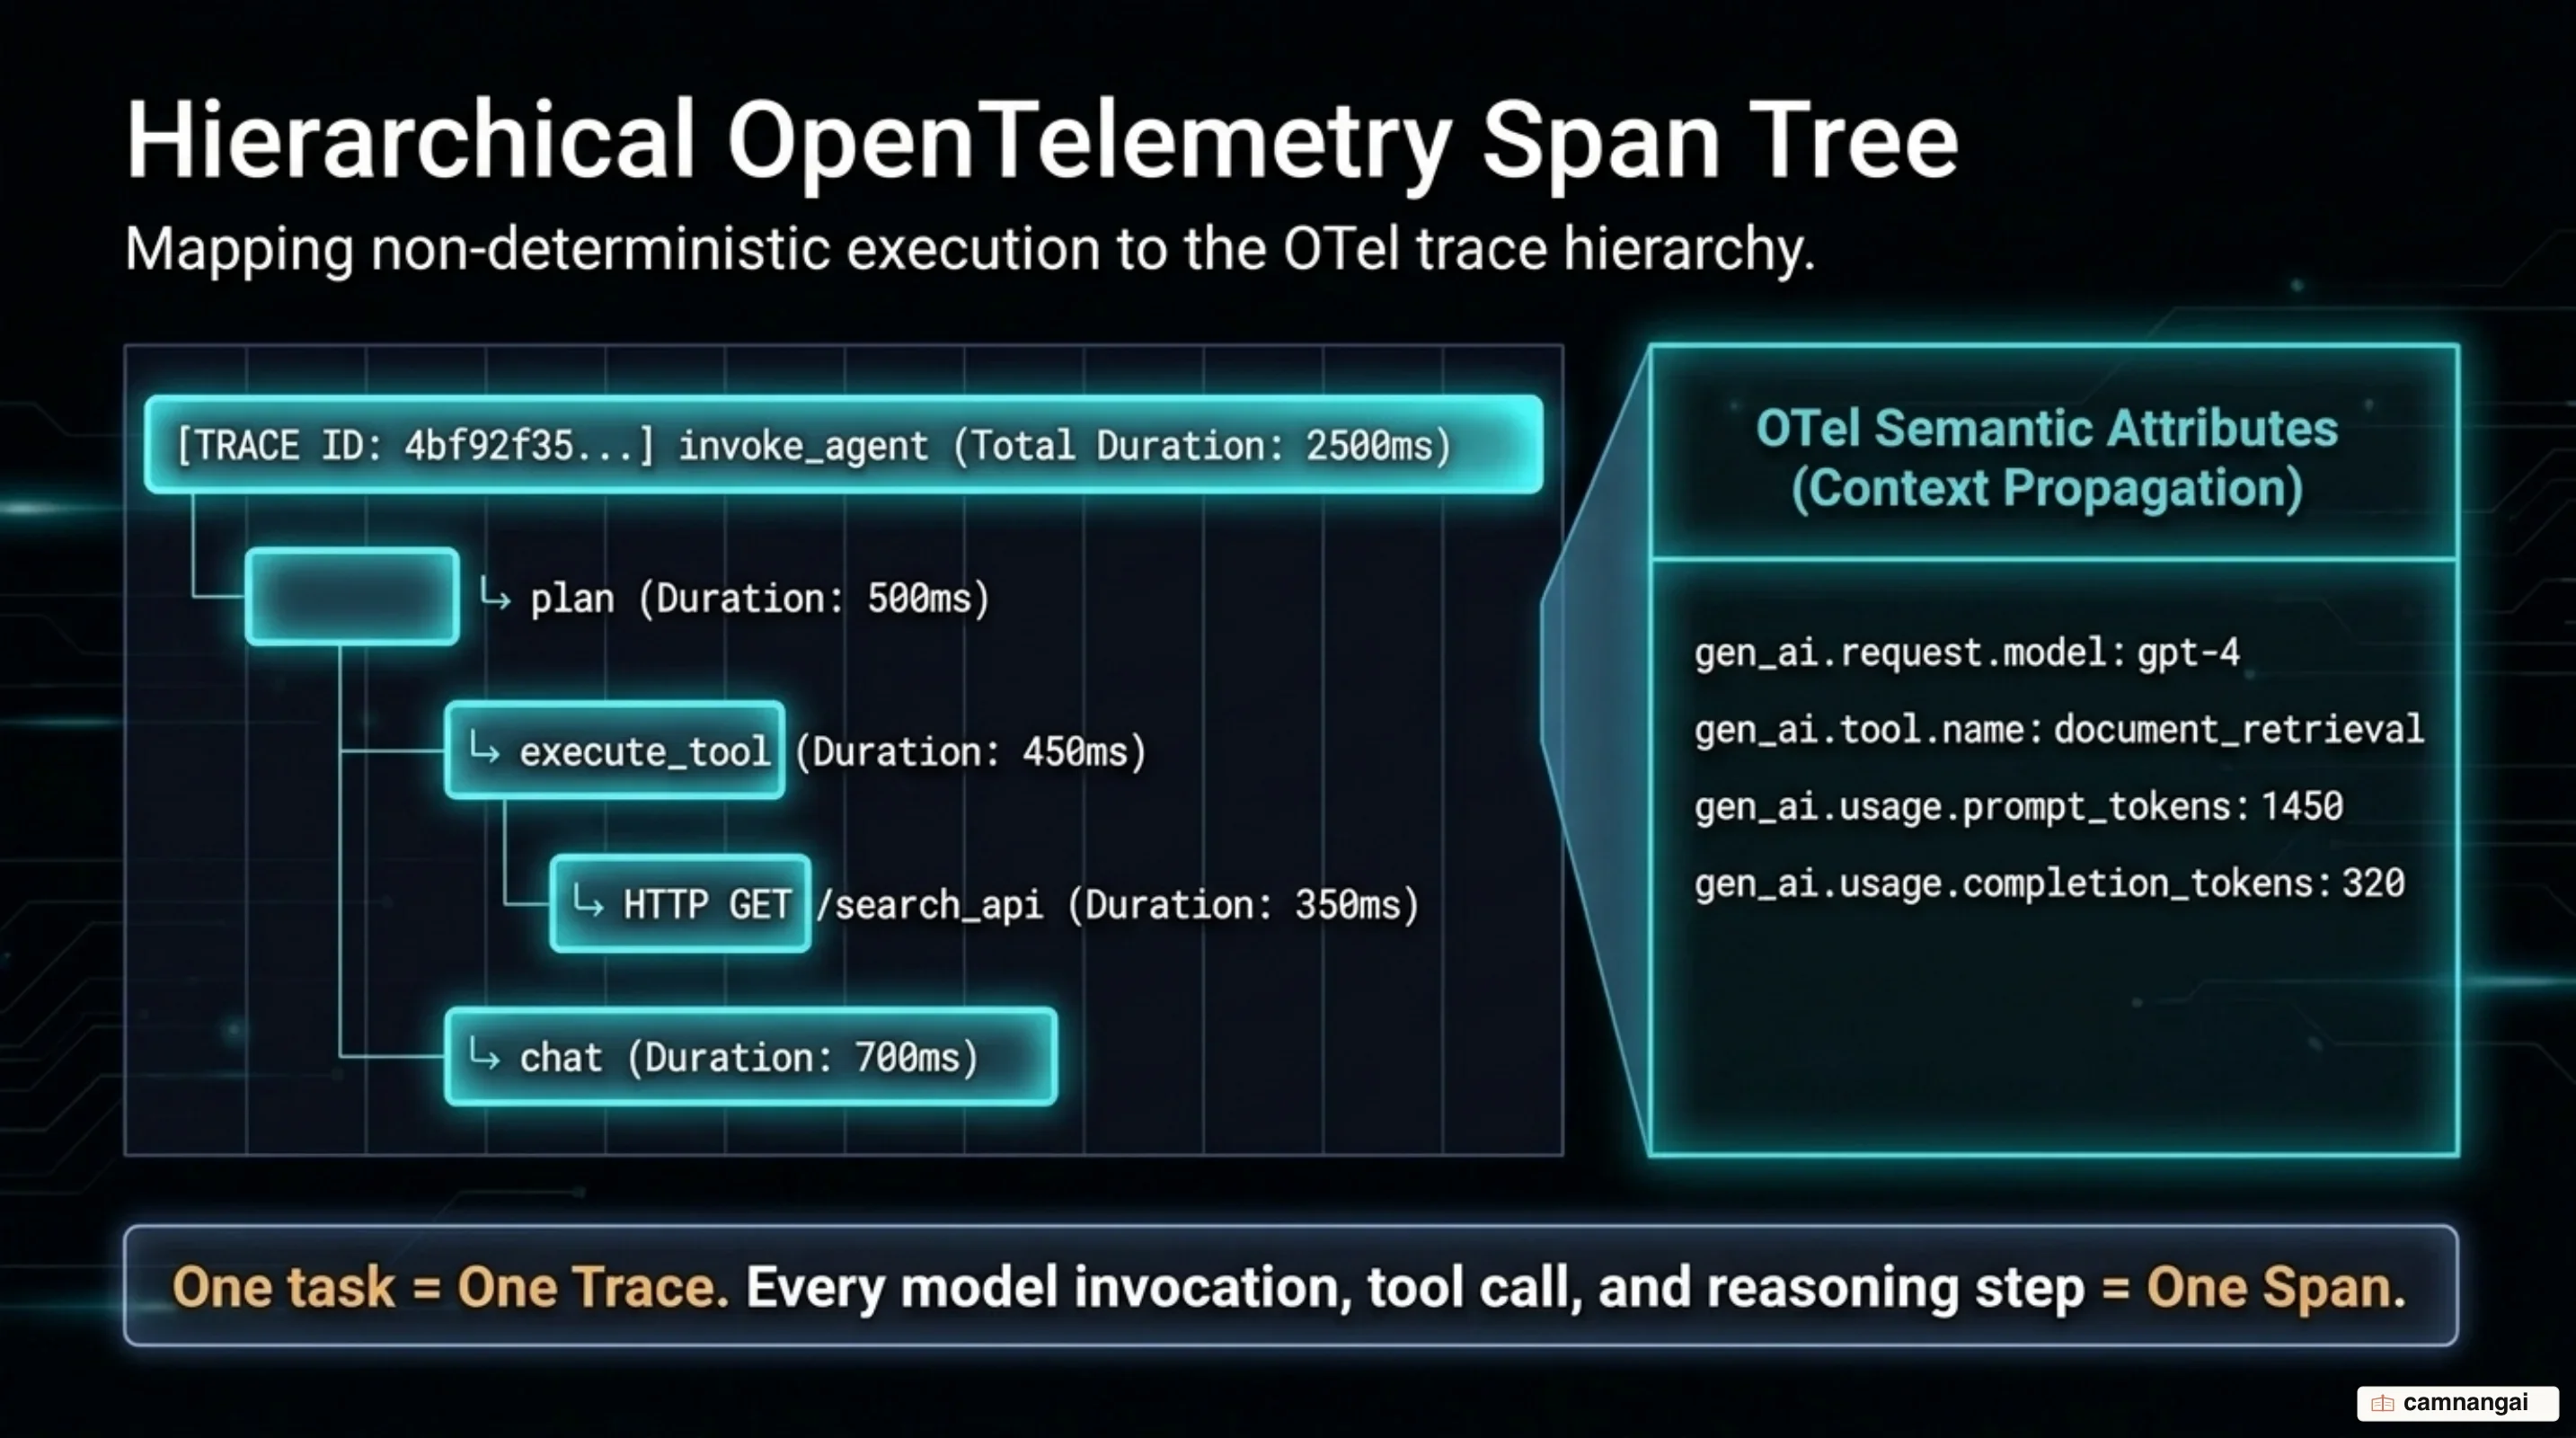
OpenTelemetry structures complex, non-deterministic agent executions into a hierarchical span tree. Rather than viewing an operation as a single flat trace, an agentic trace organizes every phase of execution into typed spans. Standard GenAI span classifications include Agent spans (representing top-level orchestration and goal processing), Chain/Workflow spans (representing sub-pipelines or business logic sequences), LLM spans (capturing model generations and completion outputs), Tool spans (tracking external function calls and API executions), Retriever spans (monitoring vector database searches), and Embedding spans (tracking vector conversion operations).
# Conceptual OpenTelemetry Agent Trace Structure
[AgentSpan] fetch-ordering-agent (Root Span)
 ├── [ChainSpan] fetch.parse_order
 │ ├── [ToolSpan] check_item_availability (142ms)
 │ └── [ToolSpan] check_store_hours (98ms)
 ├── [LLMSpan] claude-opus-4-7 (Generation: 702 tokens)
 └── [ToolSpan] add_to_cart (212ms)
The hierarchical parent-child relationships established by OpenTelemetry link a top-level user session down to individual LLM completions and backend tool executions. When a user submits an initial prompt, a root Agent span is initialized. As the agent reasons through the task, child spans are instantiated for each sub-task—such as executing a tool or invoking an LLM generation. If a tool call triggers a subsequent workflow or model call, those executions become child spans of the tool span itself. This parent-child nesting maintains strict context across multi-turn execution loops.
# Programmatic OpenTelemetry SDK & OTLP Exporter Setup
from opentelemetry import trace
from opentelemetry.sdk.trace import TracerProvider
from opentelemetry.sdk.trace.export import BatchSpanProcessor
from opentelemetry.exporter.otlp.proto.http.trace_exporter import OTLPSpanExporter

# Initialize TracerProvider with active resource context
provider = TracerProvider()

# Configure OTLP HTTP Exporter targeting standard ingestion endpoints
otlp_exporter = OTLPSpanExporter(
 endpoint="https://cloud.langfuse.com/api/public/otel/v1/traces",
 headers={
 "Authorization": "Basic ${AUTH_STRING}",
 "x-langfuse-ingestion-version": "4",
 }
)

# Attach BatchSpanProcessor to process spans asynchronously
provider.add_span_processor(BatchSpanProcessor(otlp_exporter))
trace.set_tracer_provider(provider)
tracer = trace.get_tracer("agent-orchestrator", "1.0.0")
From a telemetry platform and cost accounting perspective, hierarchical span trees offer significant economic advantages. Leading observability backends enforce span billing models that charge exclusively on LLM provider spans (the actual generation calls to providers like OpenAI or Anthropic). Surrounding operational spans—including workflow, tool, agent, embedding, and retriever spans—are processed without additional per-span billing charges. This unbilled operational span model eliminates the economic penalty for deep, granular tracing, allowing you to instrument micro-step tool calls, vector retrieval iterations, and orchestrator state shifts without inflating your observability bill as agent context expands.
Semantic Attributes and Data Privacy: gen_ai.* and the Opt-In Rule
Standardization in GenAI observability relies on the OpenTelemetry GenAI Semantic Conventions (gen_ai.* namespace) alongside OpenInference standards. These conventions define explicit, vendor-agnostic attribute keys for telemetry spans. Key standard attributes include gen_ai.system (identifying the model provider), gen_ai.request.model (the requested model identifier), gen_ai.response.model (the actual model returned), gen_ai.usage.input_tokens and gen_ai.usage.output_tokens (tracking token consumption), as well as gen_ai.tool.call.arguments and gen_ai.tool.call.result (capturing tool execution inputs and outputs).
| Attribute Key | Type | Description |
|---|---|---|
gen_ai.system | string | Identifies the LLM provider or system (e.g., openai, anthropic). |
gen_ai.request.model | string | Name of the model specified in the request call. |
gen_ai.response.model | string | Name of the actual model returned in the response metadata. |
gen_ai.usage.input_tokens | integer | Number of prompt/input tokens consumed in the LLM span. |
gen_ai.usage.output_tokens | integer | Number of completion/output tokens generated by the model. |
gen_ai.tool.call.arguments | JSON string | Arguments passed into a tool execution span. |
gen_ai.tool.call.result | JSON string | Output data returned from a tool execution span. |
Telemetry backends process attributes at two primary levels: trace-level attributes and observation/span-level attributes. Trace-level attributes—such as langfuse.user.id, langfuse.session.id, langfuse.trace.tags, langfuse.version, and langfuse.release—represent shared context across the entire interaction. To ensure custom metadata remains directly queryable in backend data stores, you must explicitly prefix attributes with vendor metadata namespaces (e.g., langfuse.trace.metadata.customer_tier). Standard OpenTelemetry attributes lacking this explicit prefix fall back into unindexed catch-all arrays (metadata.attributes), restricting your ability to perform direct querying and filtering across production traces.
Data governance, compliance, and Personally Identifiable Information (PII) protection require strict controls when exporting LLM traces. Enterprise observability data planes integrate sensitive data scanning and redaction mechanisms to prevent accidental exposure of PII, financial data, or healthcare records subject to HIPAA compliance. Additionally, ingestion pipelines enforce strict security guardrails against prototype pollution: attribute keys containing __proto__, constructor, or prototype as path segments (such as gen_ai.prompt.__proto__.foo) are silently dropped during parsing. You must also exercise caution regarding context propagation; OpenTelemetry Baggage automatically carries key-value pairs across service boundaries, requiring explicit opt-in rules and sanitization to prevent sensitive API keys or PII from leaking to external downstream endpoints.
Debugging in Practice: Infinite Loops, Tool Failures, and Context Propagation
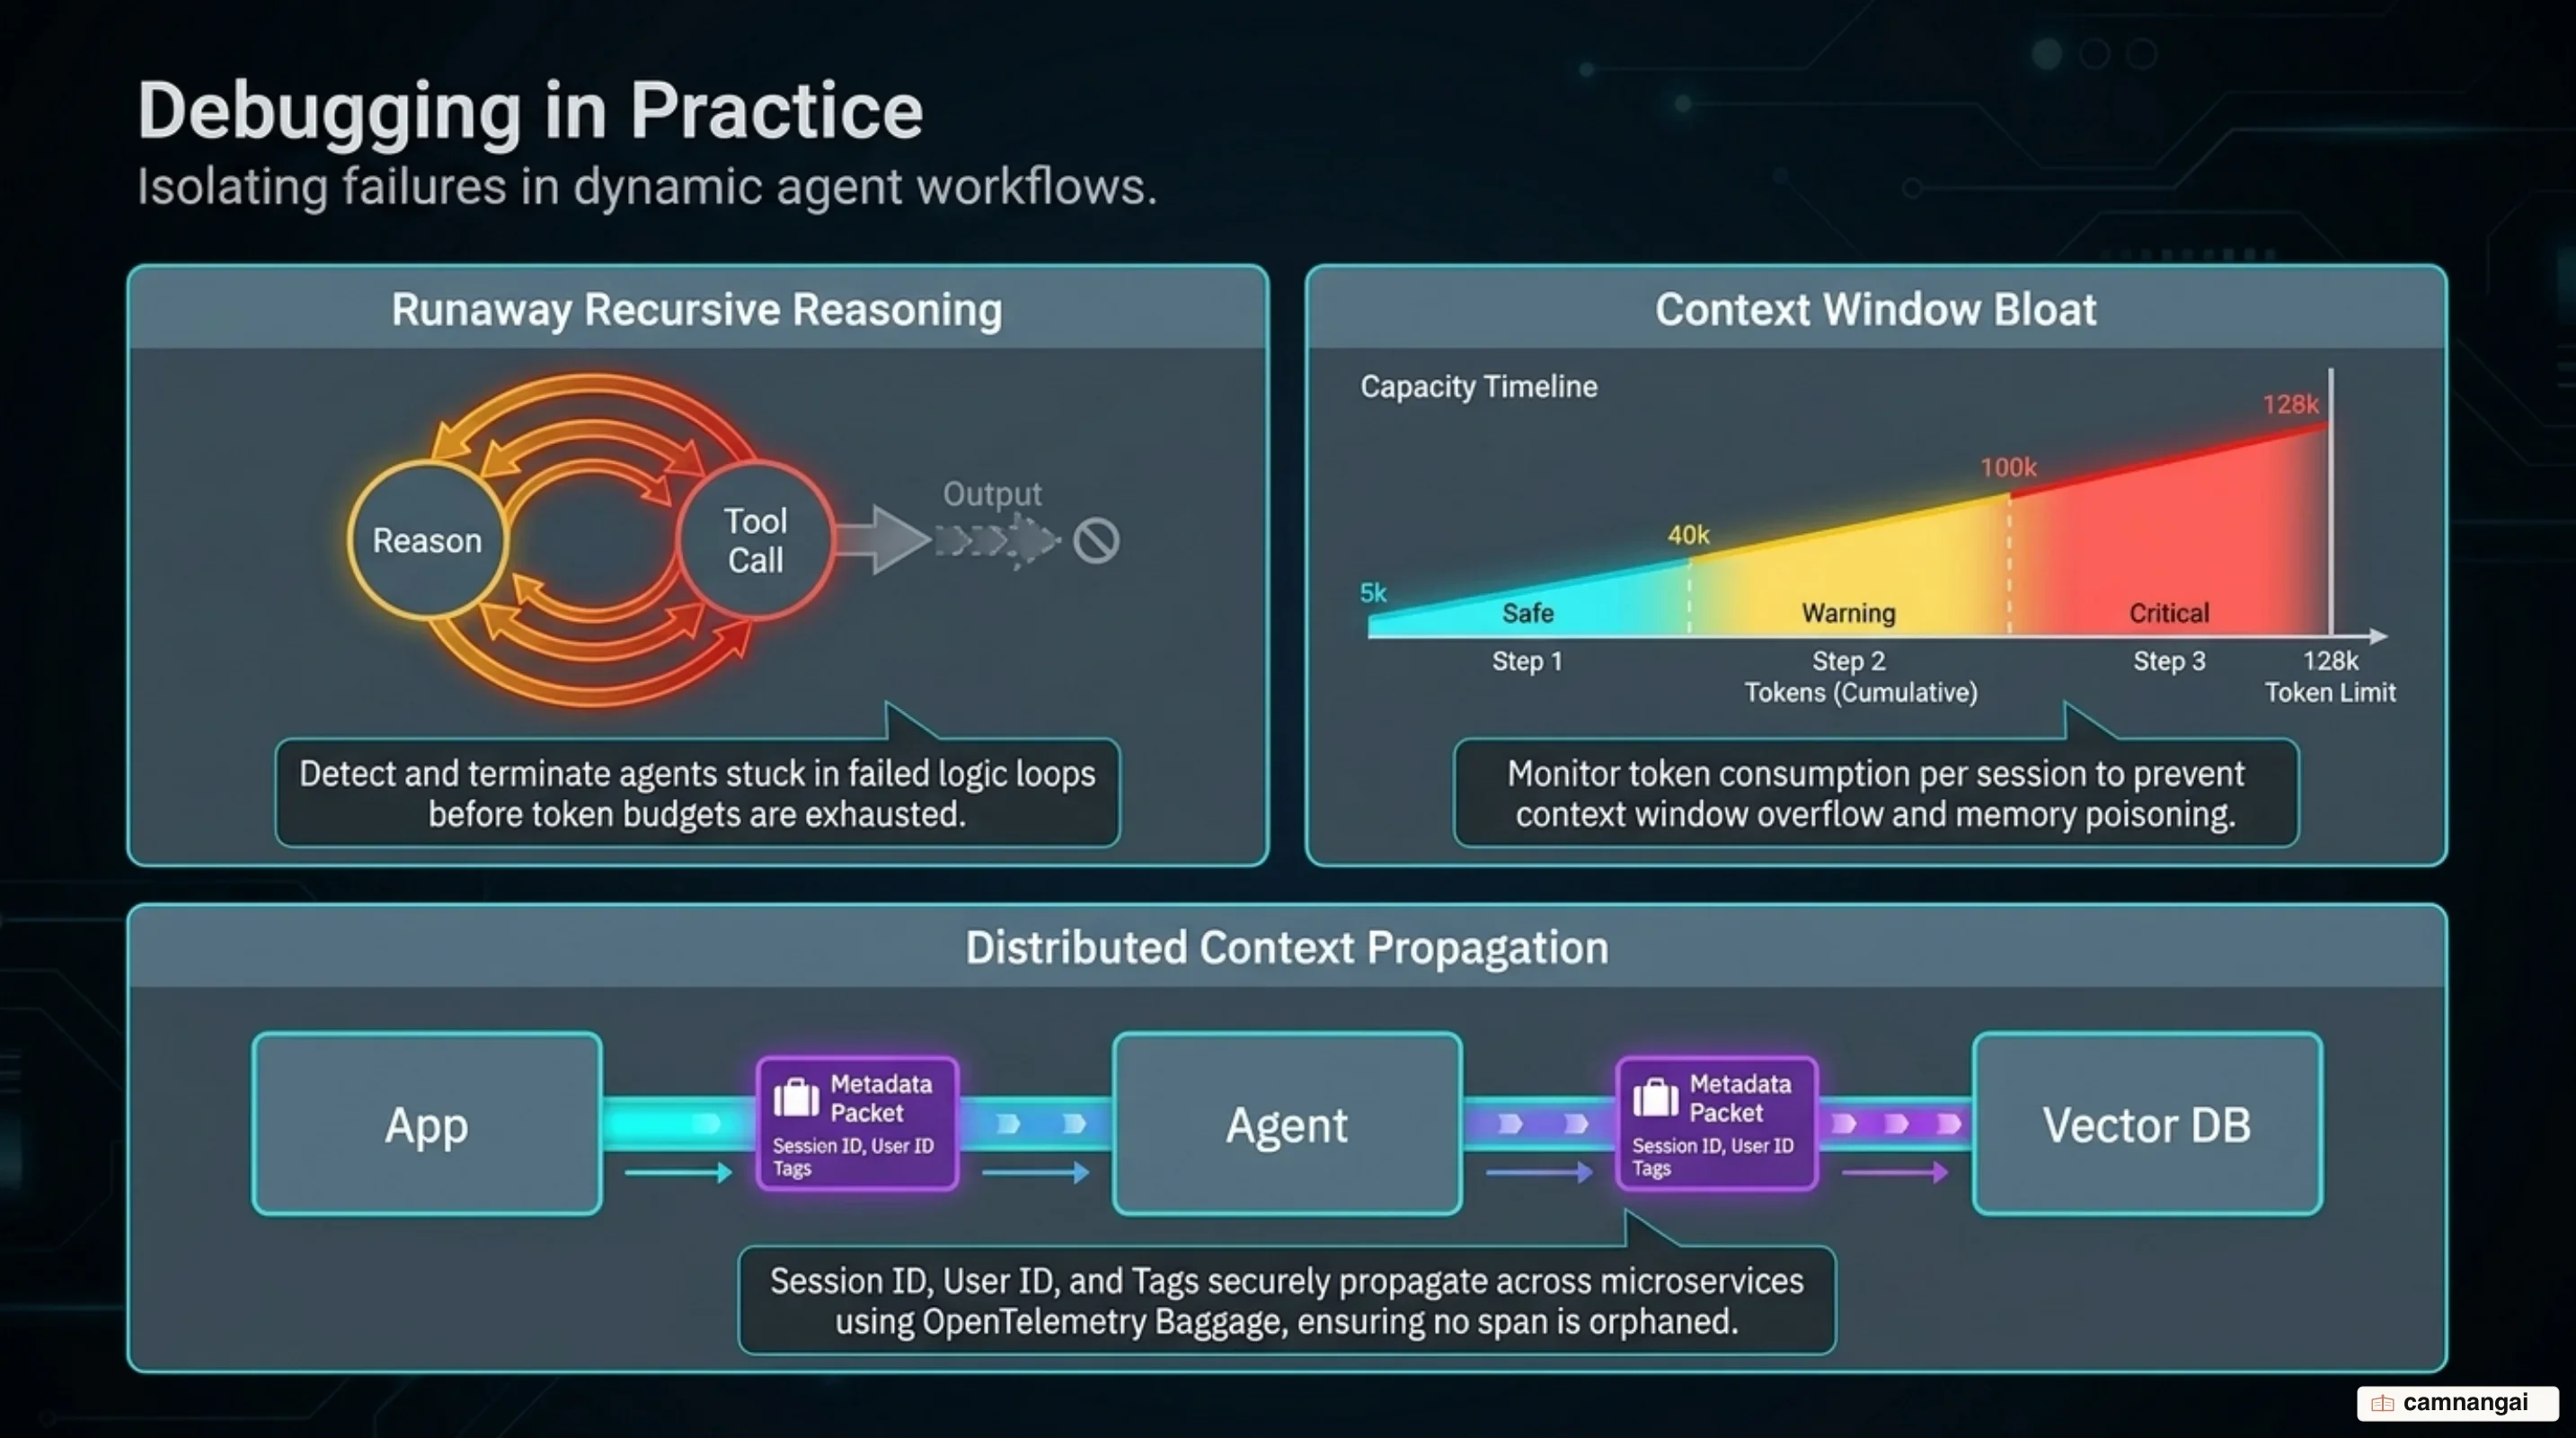
In production agentic environments, distributed tracing allows engineering teams to diagnose complex runtime failure modes that evade traditional monitoring. One common issue is the emergence of infinite execution loops and repeated trajectories. When an LLM fails to interpret a tool response correctly, it may repeatedly issue identical tool calls or cycle between redundant reasoning chains. Hierarchical execution graphs immediately surface these runaway trajectories, showing visual stacks of identical child spans and inflating step counts before the request hits a hard timeout or exceeds token limits.
Tracing is equally vital for isolating tool and integration failures from core LLM performance.
When an agent experiences high end-to-end latency, flat metrics cannot reveal whether the model generation is slow or a backend dependency is failing. Distributed tracing breaks down the precise duration of every child span, allowing you to isolate downstream tool bottlenecks—such as database N+1 query patterns inside a RAG pipeline, slow external HTTP tool calls, malformed JSON outputs returned by custom microservices, or API gateway timeouts—directly within the unified trace view.
 ┌─────────────────────────┐
 │ User / Client Session │
 └────────────┬────────────┘
 │ Context Propagation
 ▼ (OTel Baggage)
 ┌─────────────────────────┐
 │ Agent Gateway Service │
 └────────────┬────────────┘
 │
 ┌─────────────────────┴─────────────────────┐
 ▼ ▼
 ┌───────────────────────┐ ┌───────────────────────┐
 │ LLM Generation Step │ │ External Tool Service │
 │ (Tokens & Model Params)│ │ (DB Query / HTTP API) │
 └───────────────────────┘ └───────────────────────┘
Managing context explosion across multi-turn interactions is critical for controlling operational costs and latency. As a chat session progresses, the accumulated context passed to the model grows, causing input token counts and API costs to scale non-linearly. To preserve context across microservice boundaries, applications use OpenTelemetry Baggage propagation mechanisms, such as configuring a BaggageSpanProcessor. By attaching user.id, session.id, and custom trace tags to the active Baggage context, these attributes automatically propagate across distributed HTTP headers, ensuring that every downstream service, background job, or tool execution span retains full session context.
The Evaluation Loop and Agent FinOps: Optimizing Cost and Efficiency
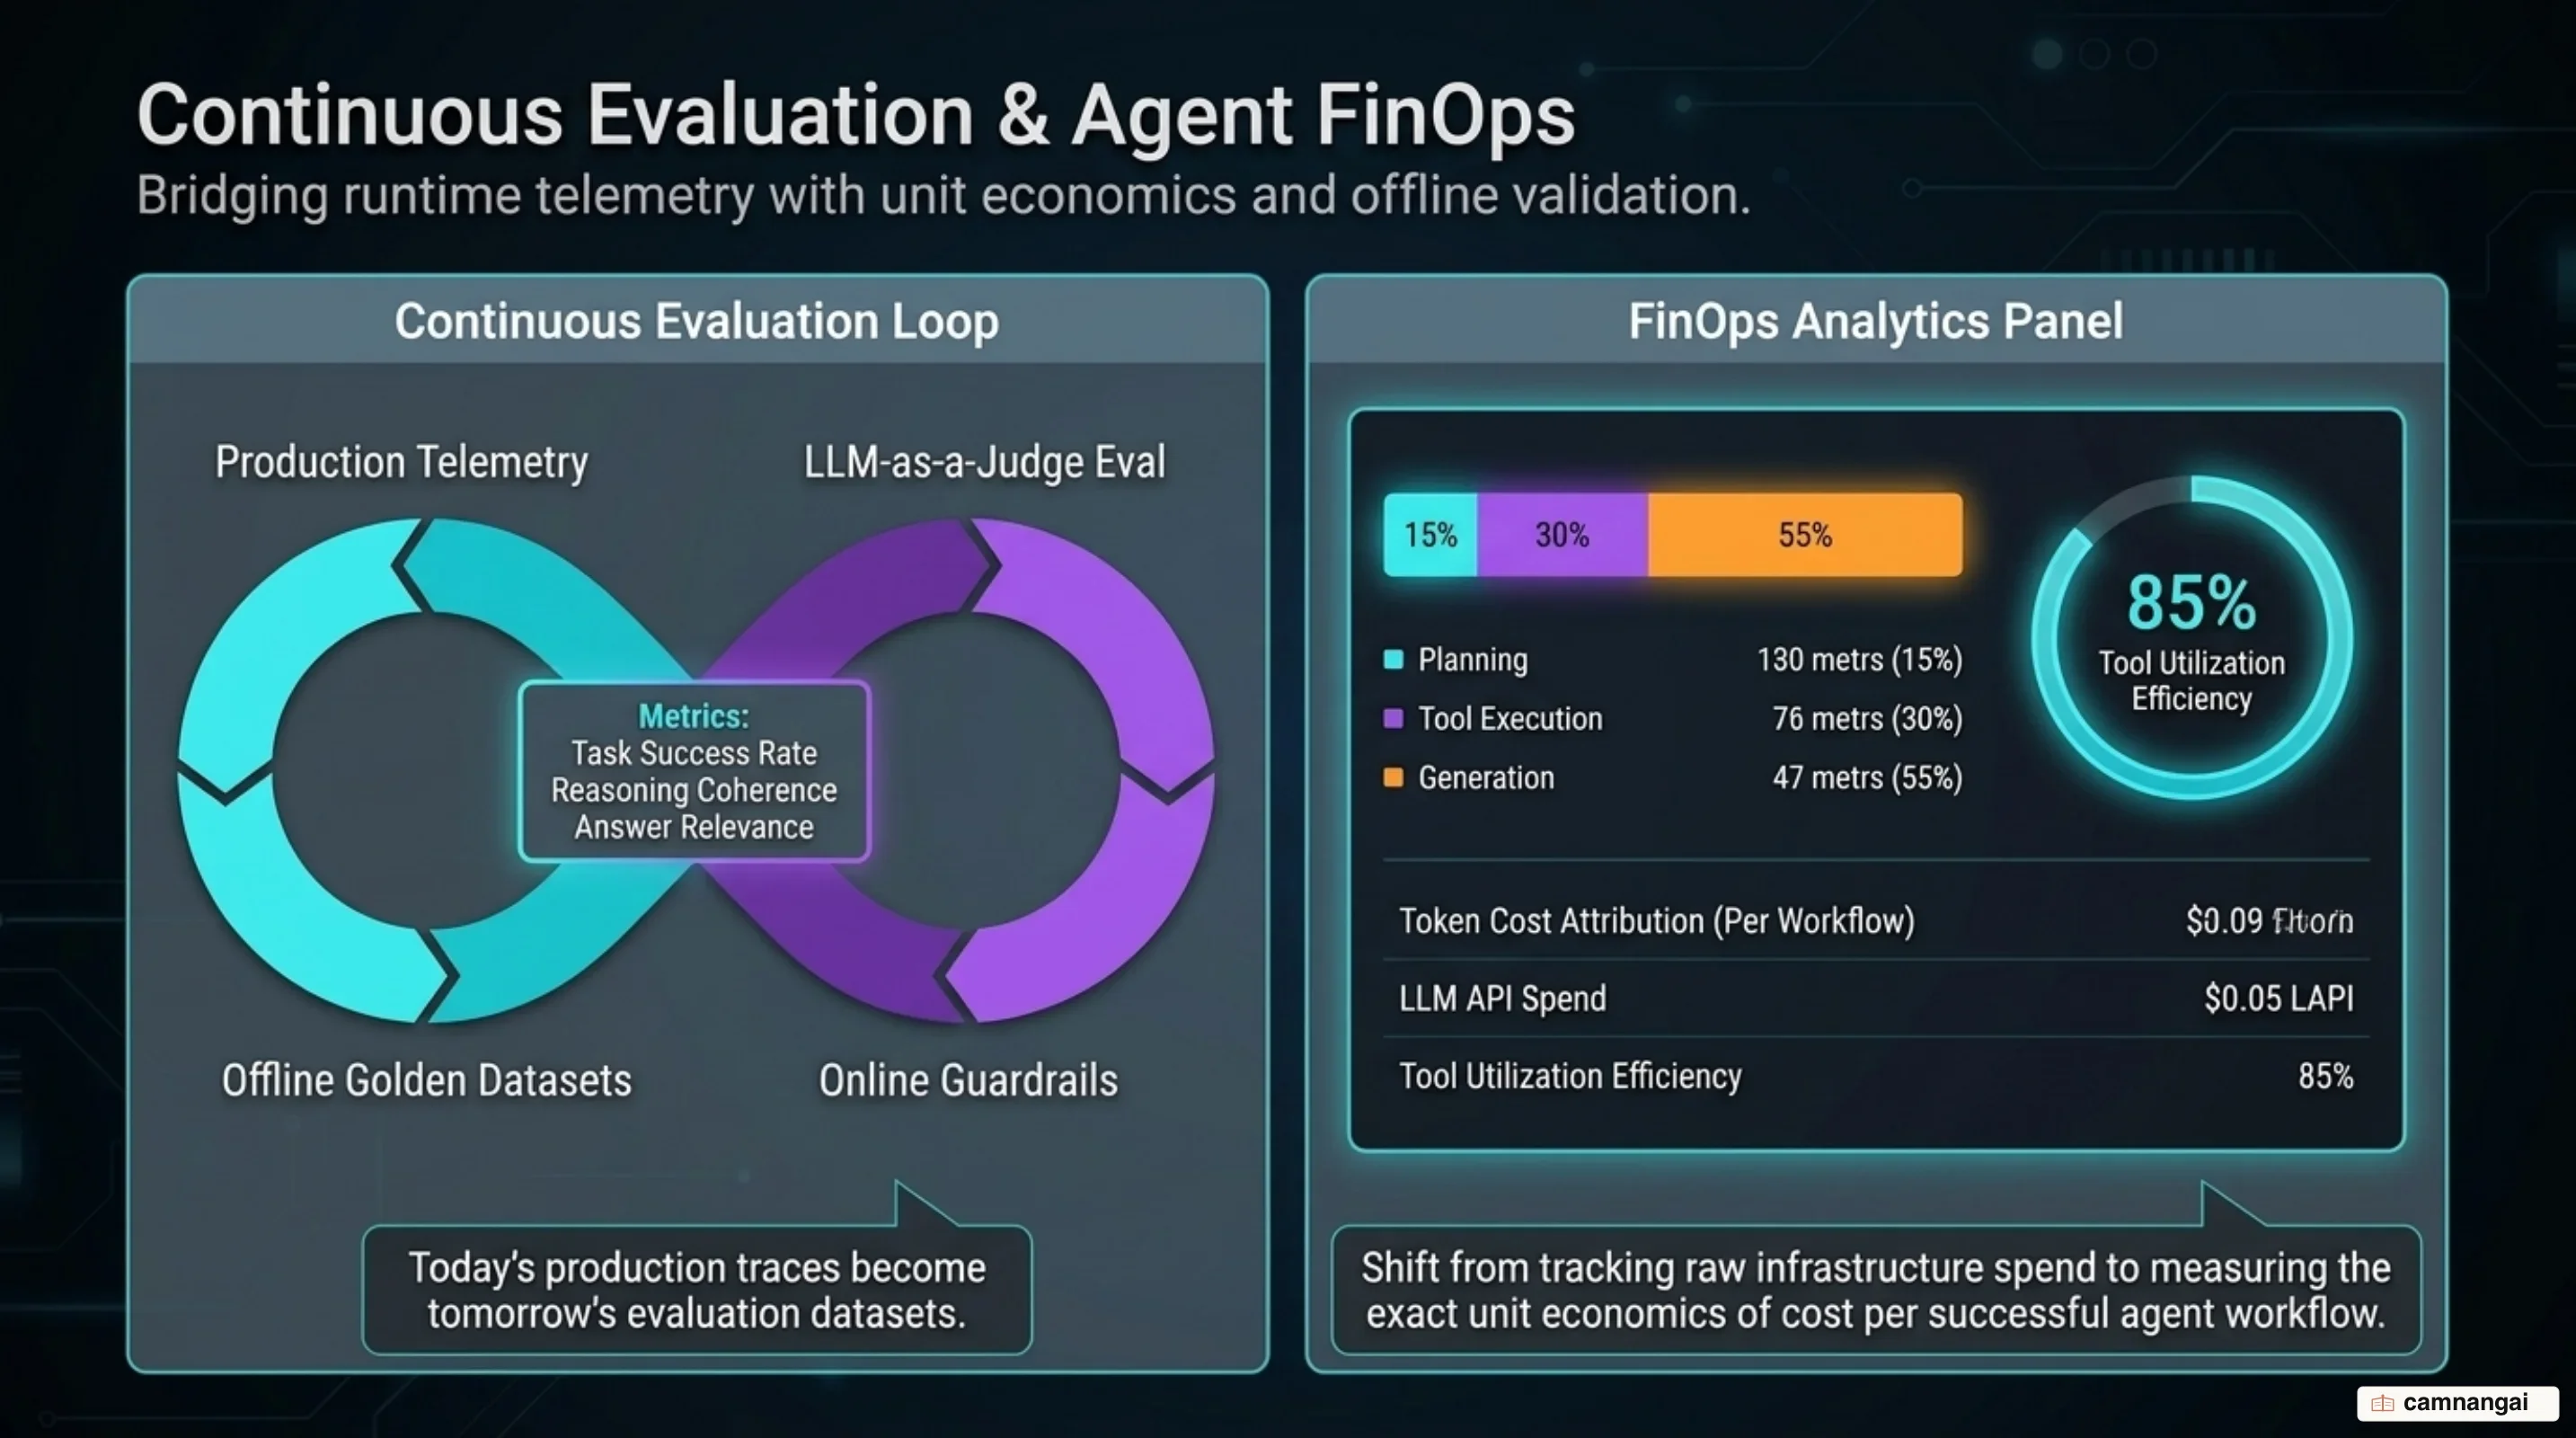
Production distributed tracing provides the empirical data required to power a closed-loop agent engineering workflow. Rather than relying on static prompt engineering or synthetic playgrounds, teams extract real production traces from live agent executions to construct versioned "golden datasets." When developers propose prompt modifications, model upgrades, or tool adjustments, they execute offline experiments against these real-world production baselines. Validating system performance against annotated datasets before deployment ensures that regressions in reasoning, accuracy, or formatting are caught prior to release.
 ┌──────────────────────┐ Extract Traces ┌──────────────────────┐
 │ Production Runtime ├─────────────────────────►│ Versioned Golden │
 │ Traces & Telemetry │ │ Datasets │
 └──────────▲───────────┘ └──────────┬───────────┘
 │ │
 │ Ship Validated │ Run Offline
 │ Changes ▼ Experiments
 ┌──────────┴───────────┐ Human & Automated ┌──────────────────────┐
 │ Production ◄──────────────────────────┤ Prompt & Model │
 │ Deployment │ Evaluators │ Experimentation │
 └──────────────────────┘ └──────────────────────┘
Comprehensive agent evaluation strategies combine automated online/offline evaluators with structured human review and annotation workflows. Built-in and custom evaluators automatically grade traces for metrics such as hallucination rates, prompt injection vulnerabilities, and output quality scores. For subtle edge cases where automated rules fall short, traces are routed into structured human review queues. Subject-matter experts annotate outputs, providing ground-truth labels that continuously refine evaluation benchmarks and improve model fine-tuning data.
From a financial engineering (Agent FinOps) perspective, detailed telemetry is essential for controlling model costs and optimizing system efficiency.
Tracing provides granular visibility into token consumption per task, allowing engineering teams to evaluate model selection trade-offs—such as swapping high-cost models (e.g., Claude Opus) with lightweight models for basic parsing steps. Implementing end-to-end agent observability delivers direct operational performance improvements:
- Up to 400% faster Mean Time to Resolution (MTTR) when diagnosing complex production agent failures.
- 40% reduction in token usage per task through context optimization and elimination of redundant tool execution loops.
- 15% faster deployment cycles achieved by automating pre-release evaluation against production-derived datasets.
Where to Start: Instrumenting the Data Plane Before Scaling Agents
Deploying standard OTLP collectors and context propagation rules prior to scaling agent workloads prevents unobservable trajectory failures, blind API spending, and fragmented trace contexts across distributed microservices.
Engineering teams can bootstrap observability using native SDKs (ddtrace, OpenInference libraries)
across multi-language enterprise stacks including Python, Node.js, Java, and Go. In Go environments,
teams rely on packages such as openinference-instrumentation-openai-go or
openinference-instrumentation-anthropic-sdk-go. In Java applications, annotation-based tracing via
@Chain, @LLM, @Tool, and @Agent combined with ByteBuddy bytecode manipulation enables
explicit span generation without cluttering core business logic.
Auto-instrumentation libraries automatically hook into model clients (OpenAI, Anthropic, Bedrock, Ollama) and orchestration frameworks (LangChain, CrewAI, AutoGen, LlamaIndex, PydanticAI, Agno). These instrumentors intercept request and response payloads, emitting standard OpenTelemetry spans with pre-populated gen_ai.* semantic attributes, token counts, and step latencies.
To target OpenTelemetry backends such as Langfuse, Arize Phoenix, or Honeycomb, configure your runtime environment with standard OTLP variables:
# Standard OpenTelemetry OTLP Exporter Configuration
export OTEL_EXPORTER_OTLP_ENDPOINT="https://cloud.langfuse.com/api/public/otel"
export OTEL_EXPORTER_OTLP_HEADERS="Authorization=Basic ${AUTH_STRING},x-langfuse-ingestion-version=4"
export OTEL_SERVICE_NAME="agent-execution-service"
If you are using Datadog LLM Observability natively in Python, use the dedicated Datadog tracer configuration:
# Datadog LLM Observability Python Auto-Instrumentation Setup
pip install ddtrace

# Configure Datadog Execution Environment
export DD_SITE="datadoghq.com"
export DD_API_KEY="${DATADOG_API_KEY}"
export DD_LLMOBS_ENABLED=1
export DD_LLMOBS_ML_APP="agent-execution-service"

# Execute application with runtime tracing wrapper
ddtrace-run python main_agent.py
For Node.js execution environments targeting Datadog, initialize the tracer using the Node runtime import flag:
// Node.js Execution Command via Environment Flags
// DD_SITE="datadoghq.com" DD_LLMOBS_ENABLED=1 DD_LLMOBS_ML_APP="agent-execution-service" DD_API_KEY="${DATADOG_API_KEY}" NODE_OPTIONS="--import dd-trace/initialize.mjs" node server.js

import tracer from "dd-trace";
tracer.init({
  logInjection: true,
  analytics: true,
});
References
- AI Agent Observability with OpenTelemetry — System Design One
- OpenTelemetry Semantic Conventions for Generative AI — OpenTelemetry
- Observability for Generative AI with OpenTelemetry — OpenTelemetry
- OpenInference: Semantic Conventions for AI Agents — Arize AI
- OpenTelemetry Native Integration for LLMs & AI Agents — Langfuse
- Observability for AI Agents — Honeycomb
- OpenLLMetry: OpenTelemetry SDK for AI Agents — Traceloop
- AI Agent Observability in Production — Datadog